Holy Bush, look at this,
Republican administrations are bad for
American Workers. You can just slap me stupid and call me Rummy.
Today's
topic in the endlessly interesting (for data freaks) Jobs in America
Series is the growth of wages over the Reign of King George II, Royal
Emperor of the Kingdom of Bribealot. All Hail the King, kneel before
his Highness, else you may be hit with the royal bull excrement which
flows from his magnificence. Bow especially deep if he and the
Members of The
Royal Court are discussing the economy.
In the previous three
episode a few brave souls sat through endless charts detailing
Unemployment (Vol.I), Employment by Age (Vol.II), Employment by
Industry (Vol. III), so now I'll take you on a fantasy tour of Workers
Wages.
Please join me below the fold, Hands and Feet must remain inside the
car at all times, No Flash Photography please.
Hello again. Today's exploration into the "Booming" Bush Economy
(and no, I'm not talking about internet porn, pervert)
focuses on the growth of wages of non-supervisory employees. This
classification encompasses about 70% of all working people in the
US, it does not include Military Cannon Fodder, Browbeaten Government
Employees or Corrupt Executives.
So here we go.
First Some Overall Figures
Based on complaints in the comments of the last episode, I'll first
present some overall data from 1980 to 2005,
just in case there was some megatrend which would absolve the King of
any responsibility for the economic performance of the
Nation under his Thumb. Don't fret, we'll look at the minuscule
details of the past five years after this foray into the past.
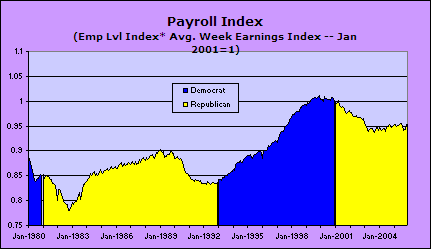
So we take the above data, combine it with employment levels and come
up with the graphical depiction of workers getting screwed
below. (Yeah, Yeah, I truncated the scale to show a larger
impact, get over it :)
So, as the untrianed and unaided eye can see, working Americans have
fared far better under the most recent DEMOCRATIC President than in any
of the Three Republican Kings. Now, the trained Right Wing Eye
will spew out all kinds of Holy Excrement, just ignore 'em, the grape
kool aid is starting to have an effect. Its the lack of
vitamins, you see, it effects the neural synapses.
 Now into some more Detail
First a Public Service Message:
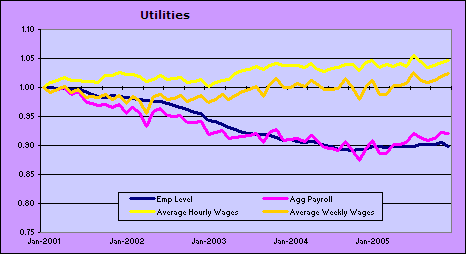
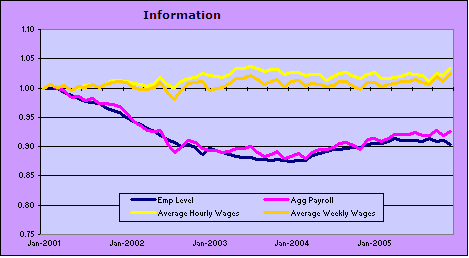
For each Industrial Sector, I created
four "indexes" from BLS Data, for all, January 2001 is the Base Period
(Index Level = 1.00)
- Employment Level Index - a measure of growth or shrinkage in a
sector based on the % of the 16-65 year old civilian population
employed in that sector in January 2001.
- Average Hourly Wages - Indexed for Inflation (Based on the BLS
1982$ Index, with the index base reset to January 2001)
- Average Weekly Wages - Indexed for Inflation (Based on the BLS
1982$ Index, with the index base reset to January 2001)
- Aggregate Payroll Index - Average Weekly Wage Index x
Employment Index (same as the blue and yellow chart above)
Still here?
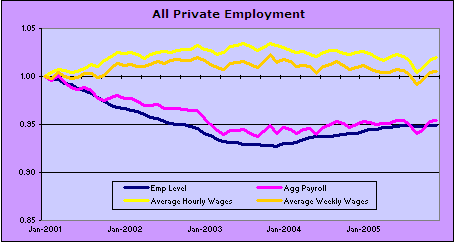
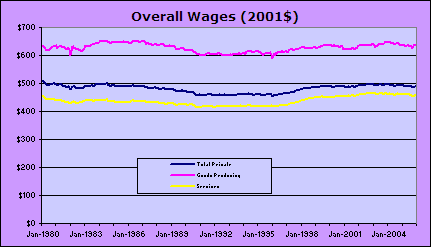
The overall numbers are looking stagnant if you are employed and dismal
if you become unemployed. The overall Private Employment Level
and Aggregate payroll levels have dropped by 5% since King George was
annointed. Not exactly
stellar growth. Hourly wages and Weekly earnings have
barely stayed ahead of inflation. Just barely.
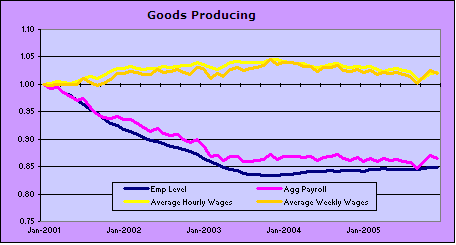
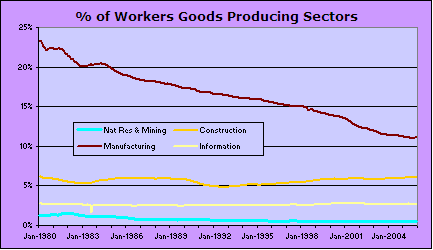
Hear that huge sucking sound, its a brain slug on George II's head,
it's starving, or it could be goods producing jobs leaving the country.
Why aren't they recovering, see the construction chart below. Why
should we care? This is the "New Economy" after all and all those
old boring rust belt jobs will be replaced by the "Knowledge
Economy". If our leadership is any example, we are
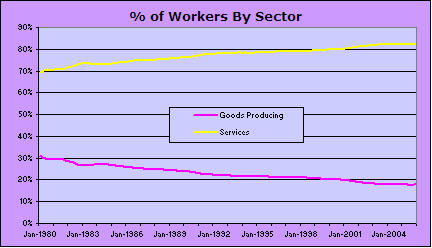
screwed. Oh yeah, also look at the wage charts at the top,
Goods Producing Jobs pay 30% more than Service Jobs. Wait, we'll
all get rich on the Stock Market, oh wait, thats still down from 5
years ago.
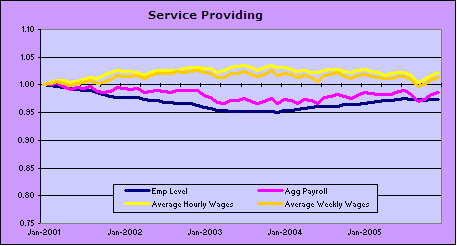
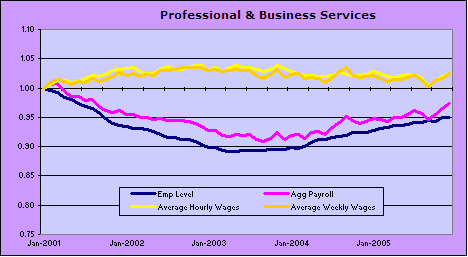
Service Providing Industries have fared better as far as the employment
level, but wages are not rising, at all. Nothing like a
little labor arbitrage to keep those workers honest. Hey, lets
all get into Service. Why make anything, just offshore it.
So now a look at individual sectors
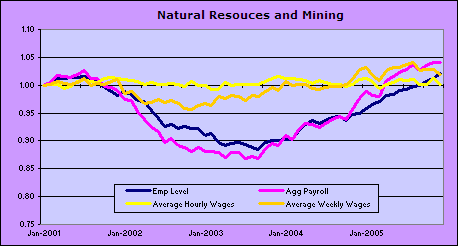
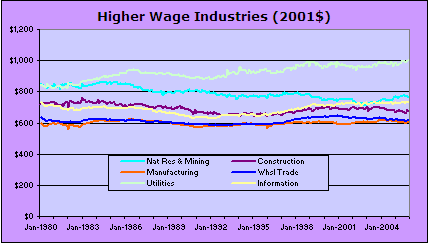
Natural Resouces and Mining Industries are doing well with the higher
prices in 2005, but this sector employs less than 1% of workers in the
US.
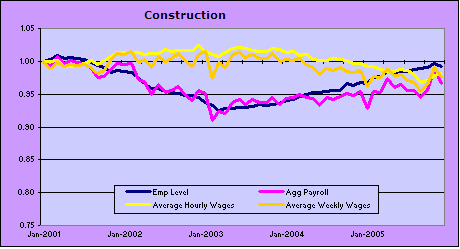
Construction, supposedly the booming sector of the economy,
really has not fared all that well. Overall construction
employment levels shrank through the first two years of the Empire of
Bribealot, employment levels are climbing back to Jan 2001 levels, but
wages are falling dramatically. This is primarily due to s
significant shift from commercial and industrial constructon to
residential.
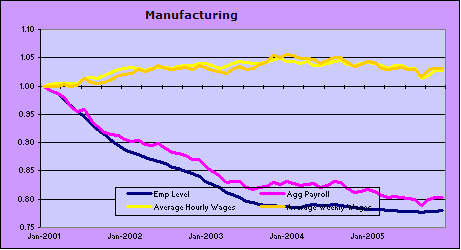
As everyone has heard, Manufacturing is sucking eggs. Although
wages have increased slightly, employment levels have dropped
23%.
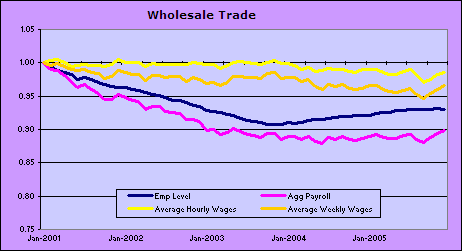
Wholesale Trade is sucking fumes out of the trickle down piss
bucket. With both wages and employment levels down significantly
since Jan 2001.
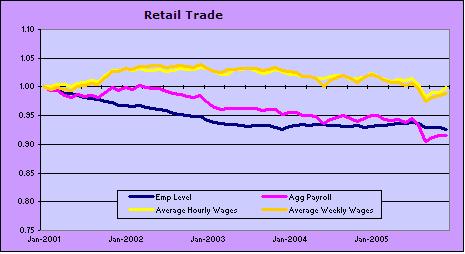
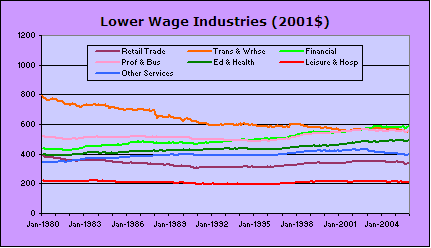
Retail Trade is sucking on the dry teat of the Bush Economy as well.
Hey, not to worry, the "New Economy" will save us, maybe not. The
sector is not doing all that well and still employs less than 5% of
American workers.
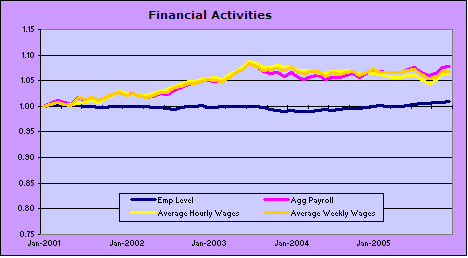
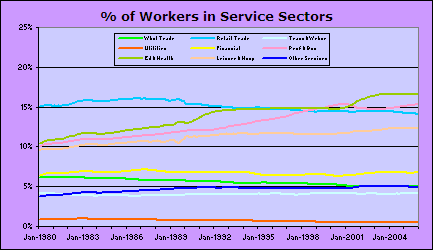
Financial services are doing well servicing the ever increasing debt of
Americans. So about 7% of american workers are happy in
this sector. Once the refi booms end, then what?
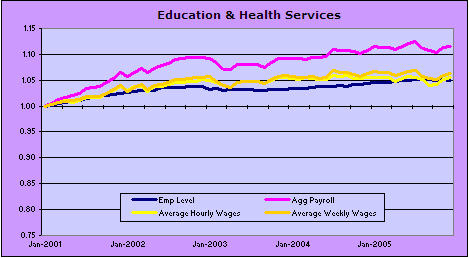
Its a good thing we're getting older and sicker. This is the only
sector showing wage and employment growth. Currently at about 16%
of workers and average weekly earnings around $450(2001$)
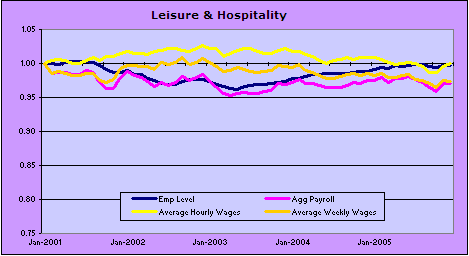
Wow, its great to see the stability in the Leisure and Hospitality industries. Got to keep all those $200 / week jobs.
Cheers,
Have a wonderful day, head over to see Bonddad's diary on the Personal Savings Rate
