From CBS Marketewatch:
New construction on U.S. homes was weaker than expected in August, calling into question the orderly economic slowdown envisioned by the Federal Reserve.
U.S. housing starts fell 6% in August to a seasonally adjusted annual rate of 1.665 million, the lowest since April 2003, the Commerce Department estimated Tuesday.
Housing starts have fallen in six of the past seven months.
In the long run - as in a year or more from now - this is actually good news because inventory levels for new and existing homes are at multi-level highs. A decrease in building activity will lower these levels eventually. However, the housing market does not turn on a dime; it will take time for these changes to eventually influence the record high inventory levels that currently exist.
The effects of the housing slowdown have barely started to effect other economic areas:
Housing is falling faster than the Fed expected, putting the "soft landing" scenario at risk, said Young Kim, an economist for Stone & McCarthy Research.
"As housing continues to stumble, the Fed will have to keep its eyes open to ensure that the 'gradual cooling' continues," said Benjamin Reitzes, an economist for BMO Nesbitt Burns.
The slowdown in home building hasn't really been felt in employment or consumer spending yet, but it will soon, Kim said.
I would disagree with Kim's assessment regarding employment because construction employment has leveled off since the beginning of the year and retail hiring has dropped a bit since mid-year. I would add it is possible for the effect of the housing downturn to increase its effect on this and other employment areas such as professional services and mortgage banking in the near future.
The year over year change in housing starts is large
Housing starts were nearly a fifth down on August last year, while building permits fell 2.3 per cent. The slump in the housing industry is significant because it can feed through to consumer spending as home owners fear that they have less wealth.
The sharp slide in the housing market not likely to end any time soon, economists said.
Assuming a further drop in September we reckon Q3 starts will fall 35 per cent annualised, following a 39.5 per cent drop in Q2," said Ian Shepherdson, chief US economist at High Frequency Economics. "If that's not meltdown, it's pretty close."
In other words, this drop is not "statistical noise"; it's a pronounced drop from year ago levels.
It's also important to note the drop was larger than expected:
The figures were much weaker than expected by Wall Street economists. According to the MarketWatch survey, housing starts were expected to sink about 2.5% in August to 1.75 million, while permits were expected to drop 1.6% to 1.74 million
Analysts appear to be a bit behind in their assessment of the housing situation.
Here are some random statistical notes from the Big Picture Blog that show how far the housing market has fallen:
* 32.6% of new mortgages and home equity loans in 2005 were interest only, up from 0.6% in 2000
* 43% of first-time home buyers in 2005 put no money down.
* 15.2% of 2005 home buyers owe at least 10% more than their home is worth.
* 10% of all home owners have no equity in their homes
* $2.7 trillion in loans will adjust to higher rates in 2006 and 2007.
* 70% of borrowers who took out pay-option ARMS in the past year have loan balances larger than their initial loan.
* Homeowners face higher payments as mortgages are reset. Generally, monthly payments rise between $200 and $500 depending on the size of the mortgage.
* According to Reality Trac, August foreclosures were up 23% over July and 53% over a year ago.
* The number of homes for sale is at record highs, and inventories are 59% higher than a year earlier.
* New home sales are down 22% and existing home sales down 11%.
* The NASB housing market index has recorded an all-time decline.
* The housing affordability index is at a 15-year low.
* The house price-to-income (rents) ratio is off the charts. According to HSBC, in 18 states accounting for over 40% ofnational home values, the price-to-income ratio is 3.6 standard deviations above the mean.
* The OFHEO index of house prices deflated by the consumption price deflator has soared to a record high of 350 from 250 in 2001. From 1976 to 1996 it never was above 220.
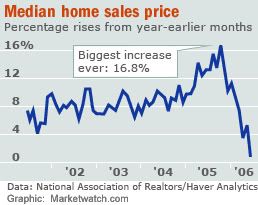
* According to the NAR the year-to year prices of existing homes are now flat. A short time ago they were rising at a yearly rate of 16%.
* Nationally, home prices have not declined on a year-to-year basis since 1933. Recently, however, prices have been dropping in the North East, West and Mid-West.
* Sales incentives are now estimated at 3% to 7% of selling prices.
In short, this is not looking like a gradual slowdown; it's looking more and more like a hard landing.
Update [2006-9-19 14:51:51 by bonddad]:: Thanks to a lynn from the comments for this graph.