Cross-posted from
Patterns That Connect
In Part 1 of this series I laid out the big picture argument:
(1) It's not liberals, but ultra-conservative movement conservatives who are far outside America's mainstream, based on data from the General Social Survey.
(2) This data shows that liberals and conservatives have significantly more overlap than disagreement across a range of controversial social issues, as well as national spending priorities.
(3) On the other hand, those wanting to downsize the welfare state represent only a small minority--even among self-described conservatives.
In this diary, I'm going to take a closer look at the national spending data. What we'll find is incredibly robust support for big government--despite how people may react to that term. Demonization can only take you so far. Indeed, we find that the welfare state is more popular than bare bones of the night watchman state that conservative ideology endorses.
The
General Social Surevey began in 1972. Questions about national spending were part of it from 1974 on, beginning with a set of 11 questions, all set in the same format:
"We are faced with many problems in this country, none of which can be solved easily or inexpensively. I'm going to name some of these problems, and for each one I'd like you to tell me whether you think we're spending too much money on it, too little money, or about the right amount. Are we spending too much money, too little money, or about the right amount on..."
Another 15 questions were added in 1984, along with 15 questions asked that year only. Two more were added in 2000 and 2002. In addition another set of questions was asked with a slightly different format in 1985, 1990 and 1996. We'll examine the responses to these four sets of questions separately, so we can see how much stability and how much variation there is.
The GSS Main Spending Sequence
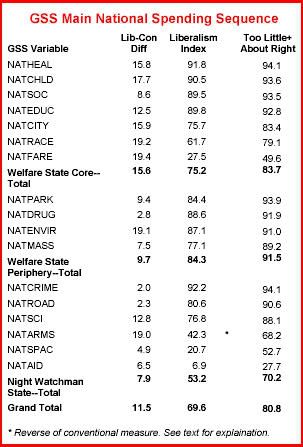
Here's the main sequence of questions:
As can be seen, liberals and conservatives have the least disagreement over functions of the night watchman state (7.9%), followed closely by the welfare state periphery (9.7%). There is almost twice as much difference over the welfare state core (15.6%) as there is over the night wathcman state. Still, that's not very much disagreement--less than 1 out of 6.
Interestingly, however, there is slightly more support for the welfare state core than there is for the night watchman state. There are two ways we measure this: (1) the combined total of those saying we're spending "too little" or "about right." This is the combined total of those who don't want to cut spending--a reasonable definition of support. Using this measure, support for the welfare state core is 83.7% compared to 70.2% for the night watchman state. (2) The "liberalism index" cuts out the middle--it's the percentage of those saying "too little" or "too much" who say that we're spending "too little." (Normally, the liberalism index is reversed for military spending, because long-term data shows an inverse relationship between support for military and domestic spending. But for our purposes, we want to focus on what kinds of spending get what kinds of support, so we're treating all items the same, for our purposes here.) Using this measure, support for the welfare state core is 75.2% compared to 53.2% for the night watchman state.
There is a relatively small number of items in our sample, so it wouldn't be wise to make too much of this comparison--yet. Still, it's a significant warning that those think the welfare state unpopular, and controversial compared to "basic government functions" cannot just assume they are right. The evidence here is that they are wrong. Not only is the welfare state popular with everyone--not just liberals--it is more popular than the night watchman state, at least from the data we have here.
As we'll see, however, this same pattern recurs again and again, in every sequence we will look at. This consistency considerably strengthens our conclusion.
Furthermore, the welfare state periphery is even more popular. While it's not the traditional welfare state that we in America identify with the New Deal, it certainly encompasses the sorts of programs that are traditionally identified with liberals. Its high popularity is another blow against the notion that liberals are an alien force in the American body politic.
The GSS Main Spending Sequence--Version Y
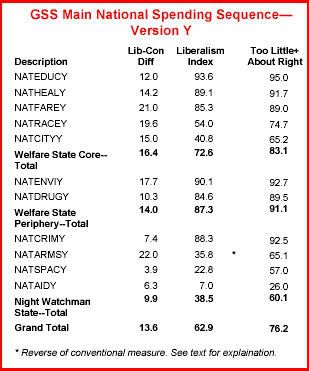
Now lets look at the second long-term sequence of data:
Here again, we see the same big picture pattern. When it comes to liberal/conservative difference, the differences between the three categories have shrunk a bit, 9.9% for the night watchman state compared to 16.4% for the welfare state core, with the welfare state periphery at 14.0%. But the difference in support levels has
increased: 72.6% to 38.5% in terms of liberalism index, and 83.1% to 60.1% in terms of those not wanting to cut spending. (Again, the welfare state periphery is more popular by both measures: 87.3% and 91.1% respectively.)
It's tempting to blame this difference on foreign aid, and to claim that this is really a liberal item, part of the welfare state periphery, if not the welfare state core. However, most foreign aid is directly or closely tied to American business or military interests. Although the American people vastly over-estimate how much is spent on foreign aid as well, the perception of it as wasting money on people overseas is equally significant. However, there is no guarantee it would be more popular if peole came to see it as a boondogle for American business. Most convincingly, however, we can simly remove the item, and look at how the night watchman state would fare without it. The answer is: better, but essentially the same. Liberal/conservative disagreement would rise from 9.9 to 11.1, while the welfare state core would still best it comfortably: 72.6% to 49.0% in terms of liberalism index, and 83.1% to 71.5% in terms of those not wanting to cut spending.
The GSS Main Spending Sequence--Version Z
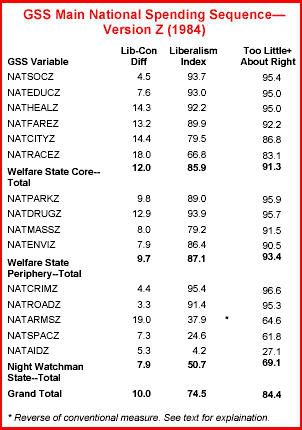
Now let's look at the 1984 "Z" sequence:
The three categories have grown closer in terms of the liberal/conservative difference: 7.9% for the night watchman state and 9.7% for the welfare state periphery--both identical to the figures for the main sequence. But the difference for the welfare state core has dropped to just 12.0%--less than one in eight. What's more, we again find that the welfare state core is much more popular than the night watchman state: 85.9% to 50.7% in terms of liberalism index, and 91.3% to 69.1% in terms of those not wanting to cut spending. The welfare state periphery again scores highest of all, with 87.1% and 93.4%, respectively.
And again, removing foreign aid from the night watchman state does not change the big picture: The difference between liberals and conservatives creeps up to 8.5%, while the welfare state core is still much more popular than the night watchman state: 85.9% to 62.3% in terms of liberalism index, and 91.3% to 79.6% in terms of those not wanting to cut spending.
Where Question Wording Does Make A Big Difference
Before looking at our fourth series, it's time to take up the two examples where wording makes a significant difference:
First, changing the wording from "assistance to big cities" to "solving the problems of the big cities" more that doubles the number of those saying we're giving too little, from 24.0% to 51.9%, and more than halves the number of those opposed, from 34.8% to 16.6%. In both versions, however, those who think we're spending too much are a small minority electorally.
Second, the effects are much stronger when it comes to helping the poor. If the word "welfare" is used, more than half the people, 50.4%, say that we're spending too much--a unique example of majority oppsition to domestic spending. Just 19.1% say we're spending "too little." But if "assistance to the poor" is used instead, the figures completely reverse: 65.1% say we're spending "too little," and just 11.0% say we're spending "too much." (Version Z, used "caring for the poor" for the one year it was asked, and got 69.4% saying we're spending "too little," just 7.8% saying we're spending "too much.")
These examples--especially the second one--open a window into a whole other realm of investigation, one that will only partially be explored in the current series. The demonizatin of "welfare" by ultra-conservatives has had an incredibly pernicious effect on our body politic, as well as on the poor themselves. But it seems to have had little impact on people's thinking about "assistance to the poor," which is, for the most part, really just another way of saying "welfare."
GSS Alternative Spending Sequence
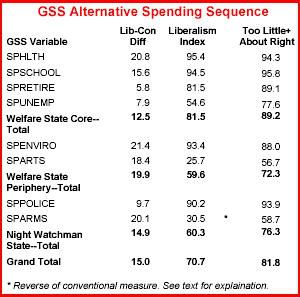
We're now ready to look at the last GSS spending sequence, one in which people are allowed to opt for large cuts or increases, for a total of 5 choices rather than the 3 used in the questions above. This is a smaller sequence, and perhaps because of that, there's a break in the pattern, as seen in the chart:
This time, the welfare state core has the least disagreement between liberals and conservatives: 12.5% compated to 14.9% for the night watchman state and 19.9% for the welfare state periphery, which is also the least popular of the three--a dramatic shift from the other results. But one thing stays the same: The welfare state core is
much more popular than the night watchman state:
81.5% to 60.3% in terms of liberalism index, and 89.2% to 76.3% in terms of those not wanting to cut spending. The welfare state periphery again falls to third, with 59.6% and 72.3%, respectively.
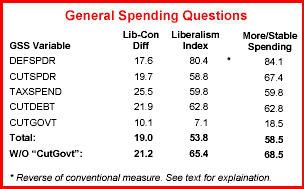
General Spending Questions
The last category we look at is general spending questions. A word of warning--one of them is about defense spending. However, it was framed as a part of a set of questions about spending in general, so we're going to keep it here. What's more, there aren't a lot of questions in this category.
From the chart, we can see that "Defspdr" is a bit of an outlier, but not as much as "CutGovt." The reason for this comes from the context in which CutGovt was asked. It was asked as one of several options for government action to spur the economy. The question asked was as follows:
758. Here are some things the government might do for the economy. Circle one number for each action to show whether you are in favor of it or against it. [There was also a neutral option.]
A. Control of wages by legislation. [SetWage]
B. Control of prices by legislation. [SetPrice]
C. Cuts in government spending. [CutGovt]
D. Government financing of projects to create new jobs. [MakeJobs]
E. Less government regulation of business. [LessReg]
F. Support for industry to develop new products and technology. [HlpHiTec]
G. Supporting declining industries to protect jobs. [SaveJobs]
H. Reducing the work week to create more jobs. [CutHours]
CutGovt was the most popular option: 81.5% favored, of which 40.2% favored it strongly. But it wasn't alone. Nor was it without contradiction.
Of these, D (MakeJobs), F. (HlpHiTec) and G. (SaveJobs) involve the government spending more money. Yet, they, too, received hefty majorities as well: MakeJobs was favored by 71%, 26.2% "strongly." HlpHiTec was fovered by 75.4%, 25.1% "strongly." SaveJobs was favored by 50.1%, 14.8% "strongly."
More precisely, 58.5% favored both CutGovt and MakeJobs, 15.2% favored both "strongly." 62.8% favored both CutGovt and HlpHiTec, 14.3% favored both "strongly." 41.3% favored both CutGovt and SaveJobs, 8.9% favored both "strongly." It's as if they were voting to go on a diet to lose 20 pounds, and to eat more ice cream at the same time. It could be done, of course. The hard part is figuring out how. In any event, it's clear that the answer to this question is not a true measure of people's overall policy preferences.
What's really interesting is a comparison between CutGovt and MakeJobs. CutGovt represents conservative orthodoxy. Calls for cutting spending to help the economy have been heard thousands upon thousands of times over the past thirty years. There is some logic to it--too much borrowing can crowd out money for private investment. But there's logic against it, too. Or more precisely, experience: when FDR cut spending in 1938, still under the sway of balanced budget orthodoxy, he temporarily killed off the recovery from the Great Depression. It was only after this experience that his administration fully embraced the ideas of John Maynard Keynes. On the other hand, "government financing of projects to create new jobs," (MakeJobs) was what Roosevelt did to employ millions of people during the Great Depression, but it's something that politicians rarely talk about nowadays. Yet, support for it was almost as high as for the budget-cutting alternative.
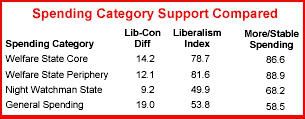
Spending Category Support Compared
We are now ready to present a grand overview. If we combine all the questions from the earlier spending series together, and sort them into the three categories we've used before, and treat general spending as a fourth category, this what we get:
The pattern we've seen before in most of the separate question sequences shows up again: (1) liberal/conservative differences increase from the night watchman state (9.2%) to the welfare state periphery (12.1%) to the welfare state core (14.2) (1) But differences are
always relatively small compared to agreement that averages 7-to-1 over disagreement in last instance. (3) The welfare state core is much more popular than the night watchman state, both in terms of liberalism index (78.7% to 53.8%) and increased or stable spending (86.8% to 68.2%); while (4) the welfare state periphery bests it slightly (81.6% and 88.9% respectively).
In contrast, the general spending questions show the highest rate of liberal/conservative disagreement--19.0%. The disagrement is still less than 1 in 5, but it's more than double the disagreement over the night watchman state. In addition, support for general spending is lower than any of the other three categories by a significant amount (58.5% to 68.2%) by one measure (more or stable spending) and is slightly above last place (52.8% to 49.9%) by another (liberalism index).
In short the greatest division in opinion and the greatest opposition come when we ask the most general kinds of questions. When we ask specific questions, opposition generally declines (20-30%) substantially while division increases modestly (3-5%). The difference between the welfare state periphery and the welfare state core is relatively small compared to the difference between both of them and the night watchman state. All this makes perfect sense in terms of a citizenry that is broadly supportive of the welfare state in particular, and broad public spending for the public good more generally. This citizenry includes conservatives and moderates as well as liberals. If it did not, (1) the overall support for the welfare state core and periphery could not approach the 90-% level and (2) the liberal/conservative difference would rise sharply moving from the night watchman state to the welfare state, rather than rising just a modest 3-5%.
Final Thoughts
Finally, we return to two items touched on briefly in passing--foreign aid and welfare. These items are notable for how anomalous they are. Their support scores in both measures diverge markedly from most other spending items. Indeed, their support levels are lower than the average for general spending category. Within that category, the single item they most resemble is CutGovt.
They clearly appear to be items about which the public lacks context. First, the designated recipients are clearly "other"--not the sorts of people the average American citizen thinks of as "us." Relatedly, they are socially remote. Most people don't know very much first hand about people on welfare or in countries receiving foreign aid. Furthermore, they have no idea how much money is being spent. Although it is rarely asked, whenever the public has been asked, they have grossly over-estimated the amount of money spent on both these items--so much so that they believe these items (which account for roughtly 1% of the budget each) constitute 20% of the budget or more, enough to make the reasoning about them bleed into thinking about spending in general, as opposed to spending on specific items for a specific purpose.
This is where the ultra-conservatives get their traction. By demonizing remote and powerless others, and demonizing liberals for caring about them, ultra-conservatives have created a narrative framework for talking about politics that is far removed from reality, but closely connected to people's ignorance, fear and prejudice. They can't get much mileage out of it in attacking the welfare state directly, because conservative support for the welfare state is far too solid for that. But these two outliers provide insight into how ultra-conservatives can and have created a narrative that is far more potent when expressed in other areas--even though it fails to produce the high levels of polarization that many assume to exist. We will take a look at those areas in our next installment.
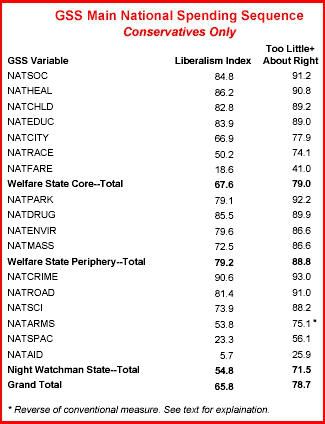
Oh, one last thing. Here's another chart of GSS main spending sequence. Just one difference. It's limited to self-identified conservatives. The only items that a majority of them want to cut are welfare and foreign aid:
In lordzorgon's front page diary,
"Republicans or conservatives?" at
Swords Crossed, he wrote:
If you dislike what is going on in our social or foreign policy, I think it is fair to blame "conservatives", because conservatives are mostly running the show in those areas. But to carry this over to economic policy, sorry -- conservatives are not running the show right now. Only faux conservatives who passed tax cuts but don't have the cojones to back them up with spending cuts.
But, as the above chart
clearly and
conclusively proves, conservatives do
not want to cut spending. It's not for lack of
cojones, as the political discourse of sexual insecurity would have it. It's because
conservatives don't want it. And while the folks in Congress are more reactionary than conservative, they can only go so far before running afoul of their base.