I was on record as saying before the election that I thought that Obama might lose by 50 or even 60 points. I was probably basing that judgment on the same thing Bill Clinton was when he said that: a look at how the counties bordering West Virginia voted.
I've looked at those counties again to come up with a quick and dirty analysis of the election that I think has not yet appeared elsewhere. The results are actually pretty stark. The bottom line: Obama didn’t do nearly as poorly relative to Hillary as the vote totals of bordering counties would suggest – he did better than the states that voted for Hillary (in March and April) would suggest, and worse than the ones voting for him (in February) would suggest.
But the main story may be that in the half of the border counties where Obama's vote share dropped relative to their neighbors who had already voted -- but Hillary's generally didn't rise. In the other half, Hillary's vote share dropped -- but Obama's generally didn't rise.
The reason for that is that a share of the anti-Barack vote has now moved to John Edwards. People know it's over -- and Hillary isn't their protest vote anymore.
Update: Before you do anything too rash based on this analysis, please see this interchage with sardonyx, below. I used NY Times numbers for this diary; he has identified an apparent coding error that inflates the vote totals for Edwards. Over 150 comments into the diary, I'm not inclined to delete this, and I don't really have another several hours free right now to redo all of the analysis with CNN's numbers. [Add: I went ahead and changed the WV numbers per CNN.] Suffice it to say that given these changes the "Edwards" effect is apparently overstated in the discussion here. In some areas such as the Eastern Panhandle, for example, it's clear that Obama lost votes directly to Hillary compared to neighboring counties, which was not what the NYT figures showed. There's still enough truth in the initial analysis to leave it alone and let the reader decide; obviously, I'd take back some of the comments that were tied too closely to the NYT numbers. Many thanks again to sardonyx for the correction, and I hope someone tells the NYT.
Here’s an executive summary:
In the thirteen counties that bordered Ohio and Pennsylvania, voters were did not vote for Hillary nearly as much: Hillary's vote percentage dropped by an average of 13 8 points, and Obama's rose by an average of 1 4 points. In the fifteen counties that border Maryland and Virginia, Clinton was roughly even up an average of 6 points and Obama's vote percentage dropped by an average of 12 10 – but that's misleading. You need to break these counties down more to see why.
In the counties in the eastern panhandle itself, excluding Pendleton, Hillary was up by an average of 2 7 and Obama down by 9 8 compared to bordering counties. In Pendleton and the two counties to its southwest, which mainly face Virginia on the East, Hillary was up by 11 17 points and Obama down by 30 28 compared to their Virginia neighbors. In the remaining counties bordering Virginia and those mostly bordering Kentucky, both candidates lost vote share: Hillary down 7 1 point, Obama down 5 3.
Clearly, different things were happening in different areas of the state – which should give us pause in generalizing about "what happened in West Virginia." Regression to the mean is clearly part of the answer: where Obama had extremely good scores, they naturally tended to fall, and where he’s done badly, they tended to rise a little. But that’s not the whole story.
Note: a basic assumption underlying this diary is that, by and large, counties on either side of a state border will tend to vote similarly. There are certainly exceptions, but especially in a generally rural state like West Virginia that is bordered generally by other rural counties, I think it is a fair hypothesis. Certainly, it's fairly prevalent.
This is going to be a quick and dirty analysis – not what I would have done for publication when I was a Political Science prof, and it makes at least one drastic oversimplification in not weighting counties by population. But, with the tools at hand, you may find it of value. The foremost of those tools is the nifty county-by-county interactive map of vote results kindly offered by the New York Times.
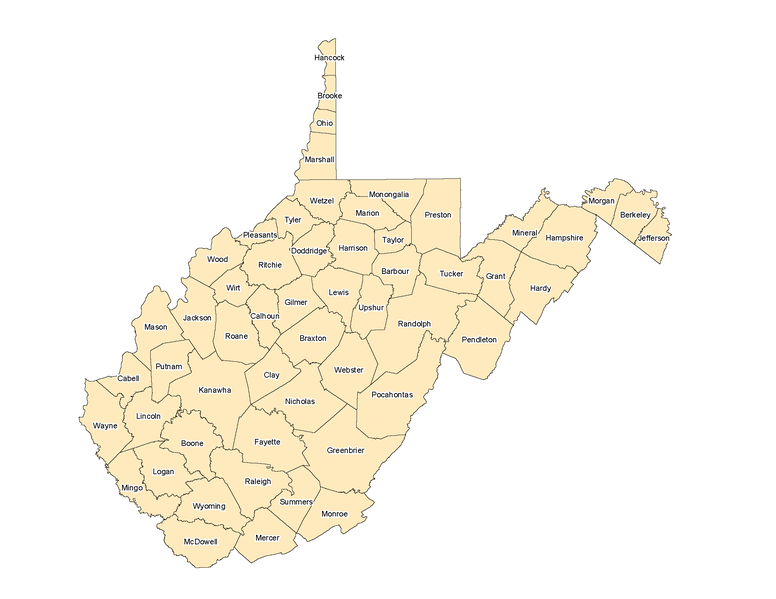
To make it easier to follow what's below, here's a list of West Virginia counties and here's a map snarfed from Wikipedia:
Update for you map fans: check out dreamingonempty's map here!
This diary will be in three sections:
(1) a list of raw vote percentages, going clockwise around the state from just north of Kentucky, for each West Virginia county that borders one or more other states, and for each county from other states that border that county.
(2) a calculation of the "expected vote" for each West Virginia county based on the totals in each non-West Virginia county it borders.
(3) a summary of the results by region – which provides a slight elaboration on the executive summary in the introduction – and a little analysis and speculation.
1. Raw vote percentages
WEST VIRGINIA NORTHWEST BORDER (WV counties are in boldface)
Cabell: C 60, O 29, C 64, O 30 borders:
Lawrence (OH): C 78, O 19
Gallia (OH): C 78, O 19
Mason: C 66, O 17 C 72, O 19, borders:
Gallia (OH): C 78, O 19
Meigs (OH): C 76, O 20
Jackson: C 65, O 21 C 70, O 23, borders:
Meigs (OH): C 76, O 20
Wood: C 62, O 24 C 67, O 26, borders:
Meigs (OH): C 76, O 20
Athens (OH): C 53, O 43
Washington (OH): C 71, O 26
Pleasants: C 57, O 23 C 63, O 25, borders:
Washington (OH): C 71, O 26
Tyler: C 59, O 24 C 64 O 26, borders:
Washington (OH): C 71, O 26
Monroe (OH): C 71, O 23
WEST VIRGINIA NORTHERN PANHANDLE:
Hancock: C 60, O 23, C 66, O 25, borders:
Columbiana (OH): C 71, O 27
Jefferson (OH): C 67, O 28
Beaver (PA): C 70, O 30
Washington (PA): C 71, O 29
Brooke C 61, O 25 C 66, O 27, borders:
Washington (PA): C 71, O 29
Jefferson (OH): C 67, O 28
Ohio C 55, O 33 C 58, O 36, borders:
Washington (PA): C 71, O 29
Belmont (OH): C 72, O 23
Jefferson (OH): C 67, O 28
Marshall C 59, O 26 C 64, O 28, borders:
Washington (PA): C 59, O 26
Greene (PA): C 75, O 25
Monroe (OH): C 71, O 23
Belmont (OH): C 72, O 23
WEST VIRGINIA CENTRAL NORTH:
Wetzel: C 59, O 23 C 64, O 26, borders:
Greene (PA): C 75, O 25
Monroe (OH): C 71, O 23
Monongalia: C 52, O 36 C 55, O 38, borders:
Greene (PA): C 75, O 25
Fayette (PA): C 79, O 21
Preston: C 59, O 22 C 66, O 24, borders:
Fayette (PA): C 79, O 21
Garrett (MD): C 56, O 34
WEST VIRGINIA EASTERN PANHANDLE
Grant: C 60, O 25 C 65, O 27, borders:
Garrett (MD): C 56, O 34
Mineral: C 60, O 22 C 66, O 24, borders:
Garrett (MD): C 56, O 34
Allegany (MD): C 58, O 32
Hampshire: C 57, O 23 C 64, O 25, borders:
Allegany (MD): C 58, O 32
Frederick (VA): C49, O 50
Morgan: C 54, O 33 C 58, O 35, borders:
Allegany (MD): C 58, O 32
Washington (MD): C 53, O 37
Frederick (VA): C49, O 50
Berkeley: C 51, O 37 C 54 O 40, borders:
Washington (MD): C 53, O 37
Frederick (VA): C49, O 50
Jefferson: C 47, O 44 C 49, O 46, borders:
Washington (MD): C 53, O 37
Loudon (VA): C 38, O 62
Clarke (VA): C 42, O 57
WEST VIRGINIA EAST BORDER
Hardy: C 55, O 18 C 63, O 21, borders:
Frederick (VA): C49, O 50
Shenandoah (VA): C 50, O 49
Rockingham (VA): C 41, O 56
Pendleton: C 60, O 21 C 66, O 23, borders:
Rockingham (VA): C 41, O 56
Augusta (VA): C 46, O 53
Highland (VA): C 45, O 54
Pocahontas: C 57, O 24 C 63, O 27, borders:
Highland (VA): C 45, O 54
Bath (VA): C 54, O 43
WEST VIRGINIA SOUTH BORDER
Greenbriar: C 57, O 27 C 62, O 29, borders:
Bath (VA): C 54, O 43
Alleghany (VA) C66, O 32
Monroe: C 61, O 20 C 68, O 22, borders:
Alleghany (VA) C66, O 32
Craig (VA), C 64, O 34
Giles (VA), C 69, O 30
Mercer: C 67, O 20 C 72, O 21, borders:
Giles (VA), C 69, O 30
Bland (VA), C 71, O 25
Tazewell (VA): C 78, O 19
McDowell: C 68, O 21 C 72, O 22, borders:
Tazewell (VA): C 78, O 19
Buchanan (VA): C 90, O 9
Mingo: C 84, O 8 C 88, O 8, borders:
Buchanan (VA): C 90, O 9
Pike (KY): n/a
Martin (KY): n/a
Wayne: C 73, O 13 C 79, O 14, borders:
Lawrence (OH): C 78, O 19
Martin (KY): n/a
Lawrence (KY): n/a
Boyd (KY): n/a
2. Determining an "expected vote" for each county
This part is quick and dirty, because I’m just taking an unweighted average of all bordering counties to determine an "expected vote".
Note that I always round both candidates down if the average ends in .5; for some reason, when I made that decision it seemed more fair to Hillary:
NORTHWEST
Cabell: C 60, O 29 C 64, O 30, bordering counties: C 78, O 19 = C down 18, O up 10, C down 14, O up 11
Mason: C 66, O 17 C 72, O 19, bordering counties: C 77, O 19 = C down 5, O even
Jackson: C 65, O 21 C 70, O 23, bordering county: C 76, O 20 = C down 5, O up 3
Wood: C 62, O 24 C 67, O 26, bordering counties: C 67, O 30 = C even, O down 4
Pleasants: C 57, O 23 C 63, O 25, bordering county: C 71, O 26 = C down 6, O down 1
Tyler: C 59, O 24 C 64 O 26; bordering counties: C 71, O 24 = C down 7, O up 2
NORTHERN PANHANDLE:
Hancock: C 60, O 23 C 66, O 25; bordering counties: C 70, O 28 = C down 4, O down 3
Brooke C 61, O 25 C 66, O 27; bordering counties: C 69, O 28 = C down 8, O up 3
Ohio C 55, O 33 C 58, O 36; bordering counties C 70, O 27 = C down 12, O up 9 (but note the complicating presence of Wheeling)
Marshall C 59, O 26 C 64, O 28; bordering counties C 72, O 25 = C down 8, O up 3
CENTRAL NORTH:
Wetzel: C 59, O 23 C 64, O 26; bordering counties C 73, O 24 = C down 9, O up 2
Monongalia: C 52, O 36 C 55, O 38; bordering counties C 77, O 23 = C down 22, O up 15 (but note the complicating presence of WVU)
Preston: C 59, O 22 C 66, O 24, bordering counties C 67, O 27 = C down 1, O down 3
EASTERN PANHANDLE
Grant: C 60, O 25 C 65, O 27, bordering county C 56, O 34 = C up 9, O down 7
Mineral: C 60, O 22 C 66, O 24, bordering counties C 57, O 33 = C up 9, O down 9
Hampshire: C 57, O 23 C 64, O 25, bordering counties C 53, O 41 = C up 11, O down 16
Morgan: C 54, O 33 C 58, O 35, bordering counties C 53, O 40 = C up 5, O down 5
Berkeley: C 51, O 37 C 54 O 40, bordering counties C 51, O 43 = C up 3, O down 3
Jefferson: C 47, O 44 C 49, O 46, bordering counties C 44, O 52 = C up 5; O down 6
EAST
Hardy: C 55, O 18 C 63, O 21, bordering counties: C 47, O 52 = C up 16, O down 31
Pendleton: C 60, O 21 C 66, O 23, bordering counties: C 44, O 54 = C up 22, O down 31
Pocahontas: C 57, O 24 C 63, O 27, bordering counties: C 49, O 48 = C up 14, O down 21
SOUTH
Greenbriar: C 57, O 27 C 62, O 29, bordering counties: C 60, O 37 = C up 2, O down 8
Monroe: C 61, O 20 C 68, O 22, bordering counties: C 66, O 32 = C up 2, O down 10
Mercer: C 67, O 20 C 72, O 21, bordering counties: C 73, O 25 = C up 1, O down 4
McDowell: C 68, O 21 C 72, O 22, bordering counties: C 84, O 14 = C down 12, O up 8
Mingo: C 84, O 8 C 88, O 8, bordering county: C 90, O 9 = C down 2, O down 1
Wayne: C 73, O 13 C 79, O 14, bordering county: C 78, O 19 = C up 1, O down 5
3. Analysis
Let’s abstract the above data even further to make the regional effects more clear:
Northwest (6 counties): C down 12, O up 1 C down 6, O up 3
N. Panhandle (4 counties): C down 11, O up 1 C down 8, O up 3
Central North (3 counties): C down 16, O even C down 11, O up 5 [n.b.: "WVU effect"]
E. Panhandle (6 counties): C up 2, O down 9 C up 7, O down 8
East (3 counties): C up 11, O down 30 C up 17, O down 28
South (6 counties): C down 7, O down 5 C down 1, O down 3
Now it’s time to face reality and draw some lessons. First, those three startling counties to the east don’t actually have that many votes – about 12,800 combined. For the sake of comparison, the four counties in the Northern Panhandle had about 30,000, Monongalia county (where WVU resides) had almost 16,000 by itself, and most of the counties in the southwest of the state were in five digits, not even counting Charleston’s Kanahwa County, so I’m not going to spent much time analyzing it. (Well, I will say this: if you're going to pick a situation where the assumption that adjacent counties are not similar, one where those counties are separated by something like the Blue Ridge Mountains may seem like a pretty likely exception!)
The main thing I take from this table (using a term that gives it more dignity than it may deserve) is that Clinton was down in vote share in WV border counties compared to their neighbors who had previously voted. Most dramatically, she was down in the northern areas bordering Ohio and Pennsylvania, by an average of 13 points per county. Some of that may be due to the presence of cities such as Huntington, Wheeling, and Morgantown, but the presence of WVU should have been largely set off by the presence of Ohio U, which (barely) borders Wood County by a tendril of Athens County. Even where Clinton's share goes down, though, Obama's doesn’t go up! If I understand the NY Times results correctly, that means that it went to John Edwards.
The reasons for this should be pretty clear. Edwards was not on the ballot in Pennsylvania, which makes a difference, and he mostly hovered in the 3-5% range in Ohio, most regularly in the Appalachian parts of the state. He was not a factor in Virginia, and again pulled about 3-5% in some parts of Maryland closest to West Virginia.
So why is he suddenly getting 7% in West Virginia? Because people know that the race is over, and if you’re going to cast a protest vote, you might as well cast it for the person on the ballot whom you really like rather than the one who’s just better than the one you like least. Hillary’s margin would have been even highly if the race had really mattered – although if that were so, Obama obviously would have concentrated more resources there – but the fact that Obama’s numbers were stable to the north and west while Hillary’s fell shows that many West Virginians were just casting protest votes. The message that it’s over has been received.
In other words, the portions of West Virginia bordering Ohio and Pennsylvania just really don’t like Obama, for whatever reason – but we can’t conclude that they like Hillary that much either, or that this win is evidence that she’d do well against McCain. These areas like a populist such as Edwards. We should compete in West Virginia, of course, but it doesn’t look like a Democratic state, whichever remaining candidate is nominated.
Now, what of the other half of the state, where Obama lost a lot of support compared to neighboring counties? The story there is that, by and large, that vote went to Edwards also. It’s not clear why Obama did so much worse in these areas than their neighbors: a lot of it may be that the panhandle counties in particular are just that much closer to DC, or perhaps this is some evidence of the character attacks having their effect, or perhaps it’s simply that Obama’s Virginia team in the upper Blue Ridge area was just that good. But at any rate, the message here is clear as well: except for those anomalous three low-population counties, when people moved away from Obama, they did not move to Hillary. Again, she was not the protest vote they wanted. Edwards was.
If the Presidential race were still competitive, Hillary may well have won by 50 points. She won by 41. It’s an impressive result, but there’s a discordant note in the chord sounding her victory: the voting patterns show that the voters have accepted that the race is not competitive.
Now, if you’re paying good attention, and you care a whit about what happens in Kentucky, you should have one question in mind right now:
Is John Edwards on the ballot?
So far as I can tell, the answer is yes. Expect him to get an awful lot of protest votes, especially in the eastern quarter of the state.
