All right, I am probably opening myself up for abuse with this diary. "Too much time on your hands, tunesmith?" "Who cares about Gallup Daily, tunesmith?" "Numbers... HURT MY HEAD, tunesmith!" I know. In my defense, I am actually getting quite a lot done this weekend, staining the deck, training for a 10k, practicing some piano, but... every once in a while I get an idea in my head I just can't shake and I get a little dogged in trying to figure it out.
So the idea here was to try and divine the daily Gallup numbers based off of their reported rolling averages.
I know, I know, it's supposed to be impossible. Billmon wrote about it, Neil got abused for it, theleftcoaster got made fun of a bit... but, like I said, I had an idea.
The problem is that when you have a history of three-day moving averages, you can't really ever figure out the daily numbers. You might find a set of numbers that make sense, but the problem is that plenty of other numbers make sense too. No matter what, you always have two unknowns in the three-day period.
But here's the thing. Gallup doesn't report just the three-day moving averages. They also report seven-day averages once a week. They're both base off of registered voters.
Numbers geeks reading this are already going ah-ha. So let me explain it to the rest of you.
From August 18th to August 24th, McCain and Obama were tied at 45.
Well, those seven days are made up of two three-day periods, plus a day. You subtract out the six days worth of data, and what you're left with is a day of known values.
Bear with me, it gets more complicated, but I'm starting simple. So, for the three-day period ending the 24th, they were tied at 45. We don't know what each of those three days were, but it doesn't matter. We subtract that out. For the three-day period ending August 21st, Obama led McCain 45-44. We subtract that out too.
McCain: (45*7) - (45*3) - (44*3) = 48
Obama: (45*7) - (45*3) - (45*3) = 45
So that means that on August 18th, the day that didn't fit either of those three-day periods, McCain polled at 48, and Obama polled at 45. Using the same technique, you can get a known value for August 11th.
Ok, you numbers geeks that are freaking out about rounding errors, bear with me. I know this still ends up inaccurate. But there's one more thing to point out.
This means that we can get a known value every seven days. That doesn't really help us figure out any other days though, because in order to figure out a third day, you need two days in a row of known values.
This is where the three-day moving average works to our benefit. If you have a known value on August 18th, and also a three-day average ending August 18th, then you know how many points are accounted for in August 17th and 16th.
And since you know those, you can get a known value for August 15th. And the 12th.
And as I noted before, we also now have a known value for August 11th. And that's two days in a row, which means that you can figure out the 13th, and then every other day in the calendar.
~^~^~^~^
Okay, back to the numbers geeks. This is all, of course, wrong. And that's because of rounding errors.
I decided to be as liberal as possible and decide that if Gallup reports a number of 45, then that means the real number could be anywhere between 44.5 and 45.4999.
So, taking rounding into account, I refigured August 18th's numbers for McCain, finding both a high range and a low range.
If on August 24th, the seven day average for McCain was 44.5, the
8/18:
McCain Low: (44.5 * 7) - (45.49 * 3) - (44.49 * 3) = 41.56
McCain High: (45.49 * 7) - (44.5 * 3) - (43.5 * 3) = 54.43
So the real truth is that on 8/18, John McCain's polling number was definitely somewhere between 41.56 and 54.43 .
Now, that's clearly not very useful by itself. "TUNESMITH, WHY AM I READING THIS?" But here's the thing, we've got a wide variety of calculation directions to take this. Backfilling is going to lead to one set of ranges. Frontfilling (once two values are known) is going to lead to another set of ranges.
Using all these ranges, we can try and compress the range for each date. If one set says the minimum for the day is 35 but another says it's 40, logic shows that 40 wins. The real number has to satisfy all the ranges. And by combining this technique with the above technique, you can get ranges for every date in the calendar.
Now, excel can't do this, but perl can. You just calculate the ranges for each date for each candidate, and then loop through for every calculation test you devise (TUNESMITH, WTF??) and adjust the ranges until you're done.
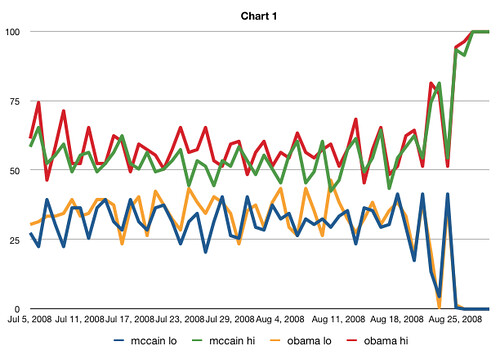
And I did that, and this is what I came up with. I backfilled and frontfilled twice apiece, after that there were no more adjustments to be made.
There you have it. We have clear, logical ranges for each date, that it's impossible for either candidate to have fallen outside of on that date.
Now, do you see how this isn't helpful? I used logic and a lot more thought than anyone probably even should, and it still shows an extremely wide range of possible numbers for each day.
So I hope this puts the issue to rest. IT IS A WASTE OF TIME TO TRY AND FIGURE OUT THE DAILY NUMBERS.
(Of course, if anyone else has any ideas on how to compress the ranges - like, if Gallup ever gave a hint by saying, say, "neither candidate has ever been above 58%" - I'm all ears.)
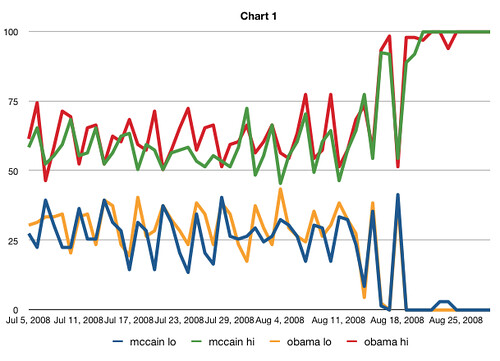
UPDATE: Thanks to a suggestion in the comments, I found a couple of enhancements. This is like solving a sudoku puzzle. Here's a slightly tighter graph.