How's that for alliteration?
When I publish my graphs about the presidential race, some people ask for predictions. So, with just over a month to go, here they are, right below the fold.
I base my predictions on several things:
Pollster's predictions; Nate Silver's simulations on fivethirtyeight; my own graphs; and, in addition youth vote, Black vote, cell phone effect, and Bradley effect.
The Pollster and 538 numbers are as of Saturday morning. Numbers from 538 are proportion of simulations won. Youth proportion is 18-24 vs. 18 and up, based on census projections.
(this is instead of Math Mania .... I'll get back to MM soon).
The easy to predict states:
McCain - 20 states with 158 electoral votes
State EV
Alabama 9
Alaska 3
Arizona 10
Arkansas 6
Georgia 15
Idaho 4
Kansas 6
Kentucky 8
Louisiana 9
Mississippi 6
Montana 3
Nebraska 5
North Dakota 3
Oklahoma 7
South Carolina 8
South Dakota 3
Tennessee 11
Texas 34
Utah 5
Wyoming 3
Obama - 15 states plus DC, 197 EV
California 55
Connecticut 7
DC 3
Delaware 3
Hawaii 4
Illinois 21
Iowa 7
Maine 4
Maryland 10
Massachusetts 12
New Jersey 15
New York 31
Oregon 7
Rhode Island 4
Vermont 3
Washington 11
Now, the hard stuff -- 15 States with 184; here I give details on each state.
Colorado 9 EV
Pollster Obama + 3.7
538 84% Obama
Black proportion of voting age population 2.9
Youth proportion of voting age population 13
My graph
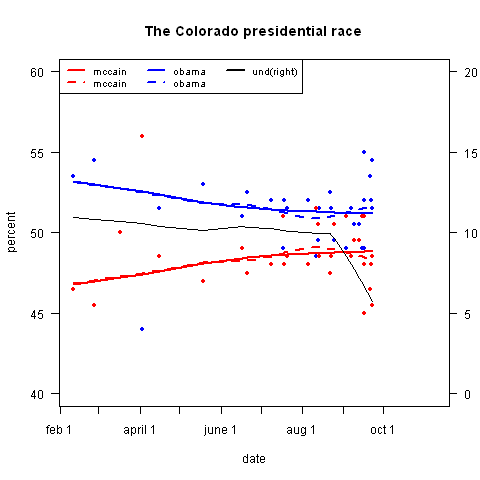
My prediction in CO: Obama by 4 points
Florida 27 EV
Pollster McCain + 3.4
538 59% McCain
Black proportion of population 12
Youth proportion of population 11
My graph
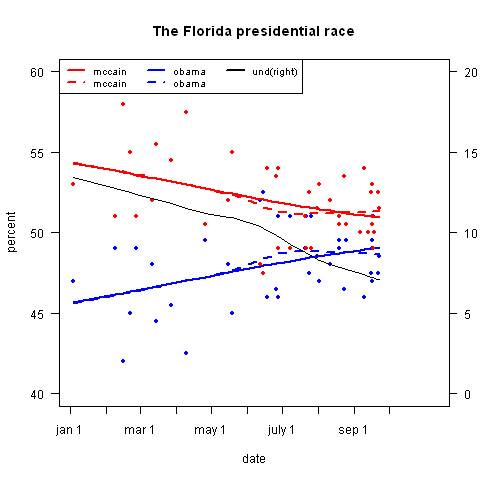
My prediction Obama by 1
Indiana 11 EV
Pollster McCain + 2.5
538 64% McCain
Black proportion of population 7.6
Youth proportion of population 14
My graph
http://i61.photobucket.com/...
My prediction in IN McCain by 1
Michigan 17 EV
Pollster Obama + 3.9
538 84% Obama
Black proportion of population 13
Youth proportion of population 13
My graph
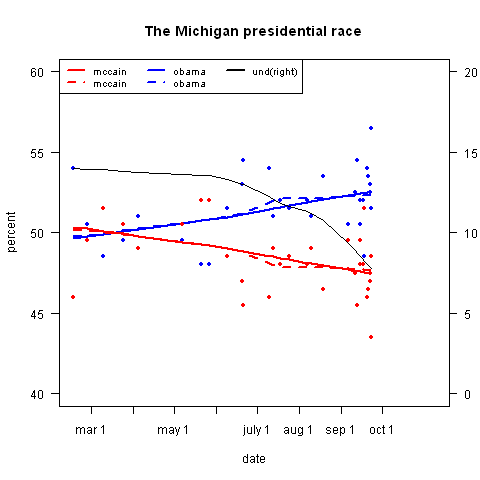
My prediction in MI Obama by 10
Minnesota 10 EV
Pollster Obama + 3.2
538 87% Obama
Black proportion of population 2,7
Youth proportion of population 13
My graph
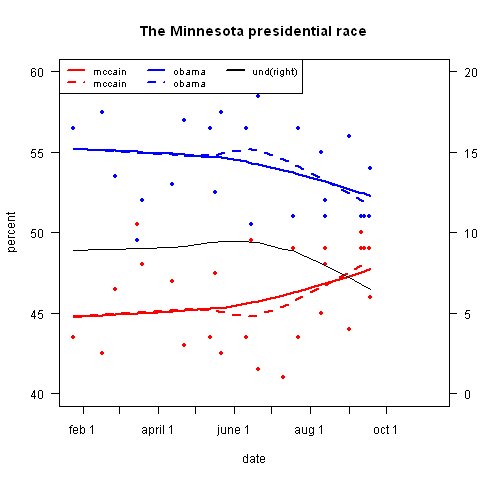
My prediction in MN Obama by 2
Missouri 11 EV
Pollster McCain + 5.1
538 70% McCain
Black proportion of population 11
Youth proportion of population 13
My graph
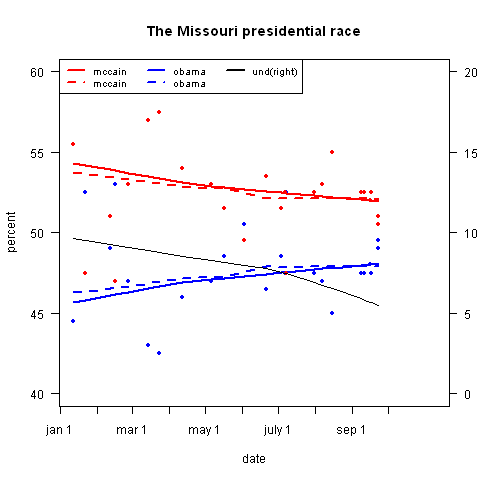
My prediction in MO McCain by 5
Nevada 5 EV
Pollster McCain +1.5
538 58% Obama
Black proportion of population 6.3
Youth proportion of population 12
My graph
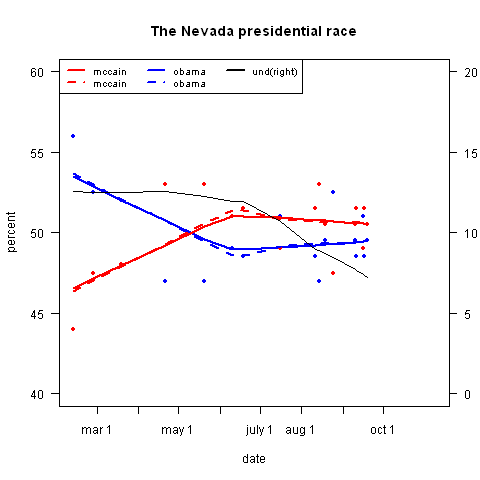
My prediction in NV McCain by 1
New Hampshire 4 EV
Pollster McCain + 0.1
538 55% Obama
Black proportion of population 0.2 (but this may be an error, see comments by Elwood, below; the right number is about 1.1)
Youth proportion of population 11
My graph
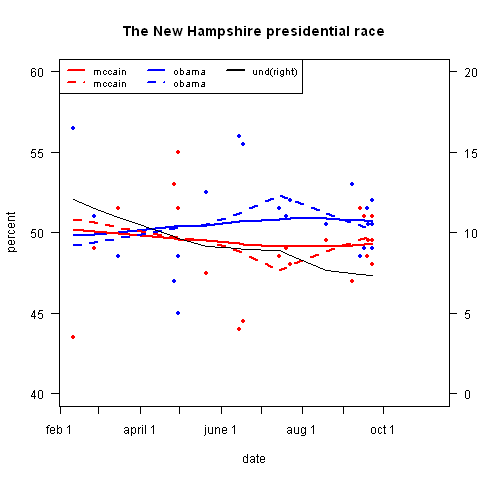
My prediction in NH Obama by 2
New Mexico 5 EV
Pollster Obama +6.2
538 86% Obama
Black proportion of population 2.5
Youth proportion of population 14
My graph
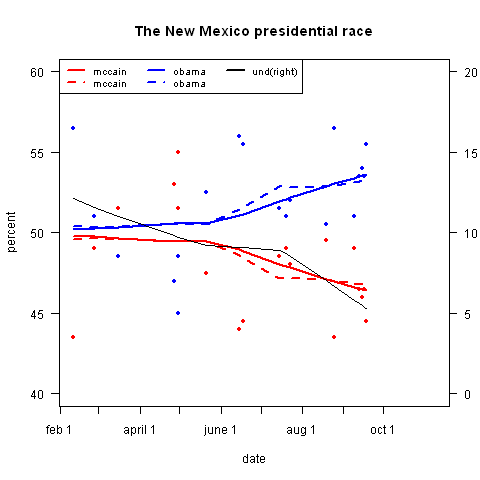
My prediction in NM Obama by 10
North Carolina 15 EV
Pollster McCain + 2.5
538 67% McCain
Black proportion of population 20
Youth proportion of population 13
My graph
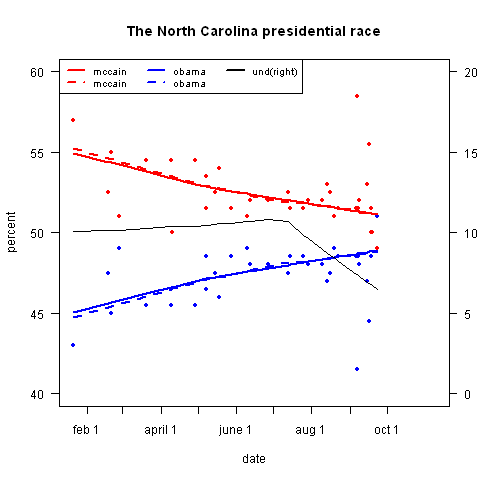
My prediction in NC Obama by 8
Ohio 20 EV
Pollster McCain + 2.8
538 51% Obama
Black proportion of population 10
Youth proportion of population 13
My graph
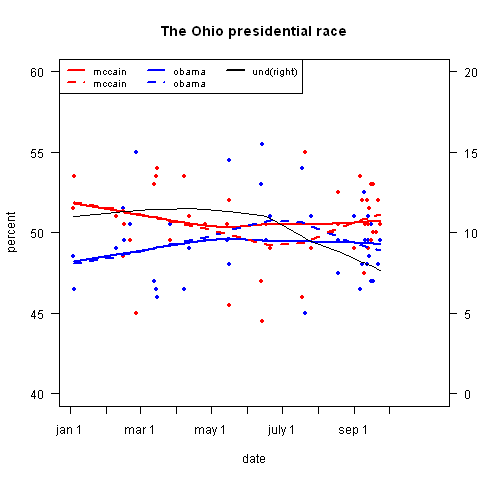
My prediction in OH McCain by 1
Pennsylvania 21 EV
Pollster Obama + 2.7
538 77% Obama
Black proportion of population 8.1
Youth proportion of population 11
My graph
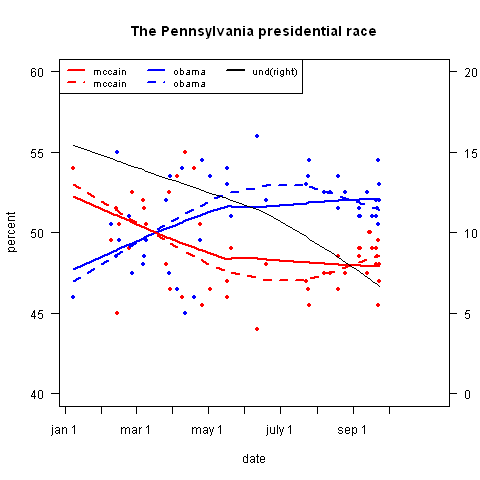
My prediction in PA Obama by 5
Virginia 13 EV
Pollster McCain + 1.0
538 79% Obama
Black proportion of population 16
Youth proportion of population 13
My graph
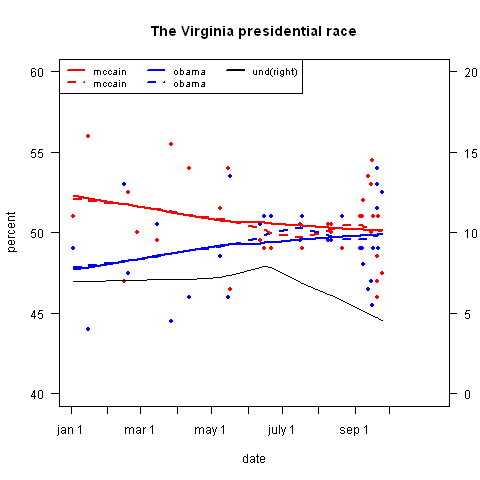
My prediction in VA Obama by 6
West Virginia 5 EV
Pollster McCain + 4.6
538 88% McCain
Black proportion of population 2.5
Youth proporti=on of population 12
My graph
Not enough polls
My prediction in WV McCain by 6
Wisconsin 10 EV
Pollster Obama + 4.4
538 87% Obama
Black proportion of population 4.4
Youth proportion of population 13
My graph
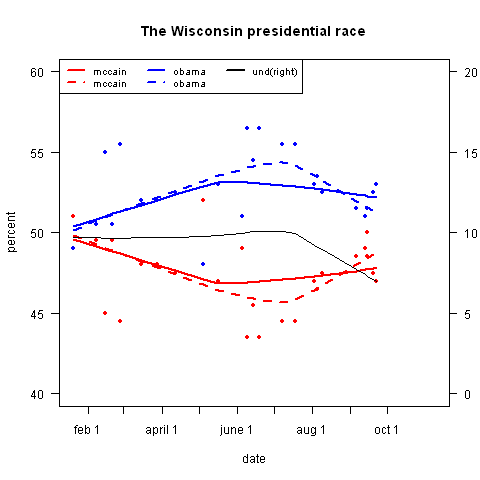
My prediction in WI Obama by 4
So.... my grand total ...
Obama 328 McCain 210
