Matt Drudge's insistence on the existence of McCain momentum has led to speculation and cherry-picking of polls on both sides to draw conclusions on the state of the race.
Since averaging polls with different sample sizes taken over an extended time period is a mathematics problem with a long track record, I thought I'd use some math to settle the question.
Graphs and conclusions below the fold.
*********Cross Posted at StochasticDemocracy**********
Before I get into any of the maths, let's see some graphs
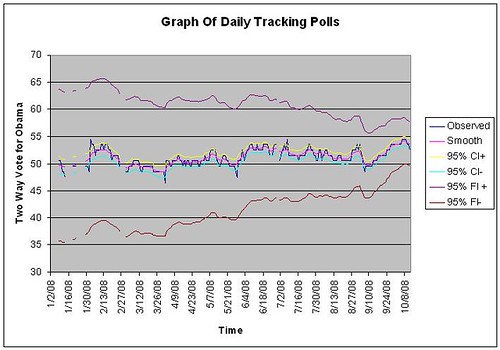
CI- The 95% confidence intervals for what public opinion is today, based on the sampling error in the poll aggregate
FI- The 95% prediction intervals for what the outcome will be in November, based on estimation of variance when treating polls as observations of a random walk(under a hidden Markov Bayesian framework).
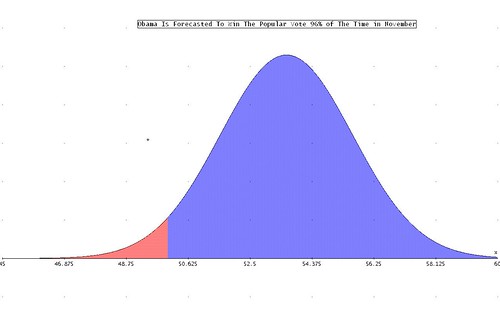
The normal approximation of the histogram of popular vote outcomes on election day
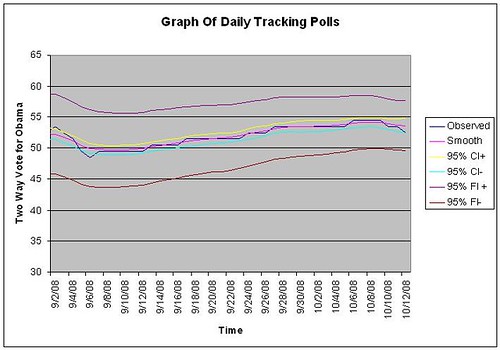
The same graph as the first, but for the last month
A quick look at the graph suggests that while there has been a bit of a tick downwards in today's poll releases, the decrease isn't anywhere close to significant. With the evidence available, it's almost as likely that Obama has increased his standing from yesterday.
Let's hope the Media holds off on speculation for a couple days..
But whether or not there has been a downtick doesn't seem very important. The important point is that Obama's lead is far outside the margin of error. Worse for McCain, it's actually outside even the 95% prediction interval for November(which takes into account that opinion changes over time)
Stunningly, the hypothesis "John McCain will win The Popular Vote in November" can be rejected with 95% confidence. That sort of thing hasn't been seen for over a decade.
As for the math behind the aggregation:
I applied the same method that I use for my state-by-state electoral projection on the site.
The basic idea is that Public Opinion follows a certain type of random walk. But unfortunately, we don't get to observe Public Opinion directly, we only have polls subject to observational error.
This can be handled in a fairly straightforward manner under a Hidden Markov Framework. The odd nature of political polling present some complications, and the interested can read more on my website.
*********Cross Posted at StochasticDemocracy**********
Update: Added the new Gallup poll. Now the tick is gone, Obama is exactly where he was yesterday
