I live in Minnesota, and like everyone here, I've been on pins and needles waiting to find out who won the Minnesota US Senate seat. As of right now, Norm Coleman is ahead of Al Franken by 237 votes, a razor-thin margin in a race that had 2.8 million votes cast.
Yesterday I started to wonder if there was any data out there that could tell me whether the manual recount was likely to tilt the election toward or away from Franken. The recount is likely to turn lots of "undervote" ballots (ballots that recorded no vote for US Senate when they were run through the optical scan machine) into counted votes, so the totals for both candidates will certainly both go up. A question that occurs to me is, where did the undervotes occur?
I downloaded the raw precinct data from the Minnesota Secretary of State website, and created a couple of simple graphs.
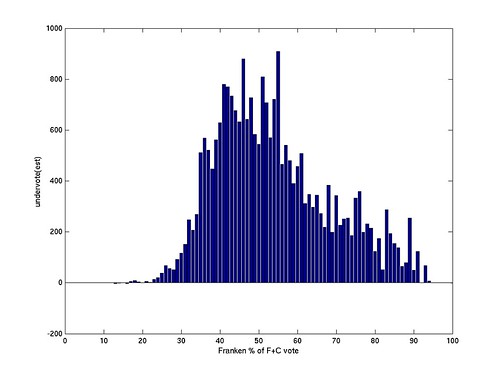
The first figure shows the raw number of estimated undervotes*, categorized by the Franken fraction of the Franken+Coleman** vote:
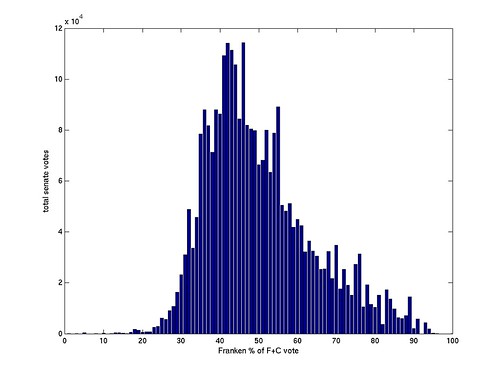
The second figure shows the total number of votes cast for president, as an estimate of the total number of ballots cast:
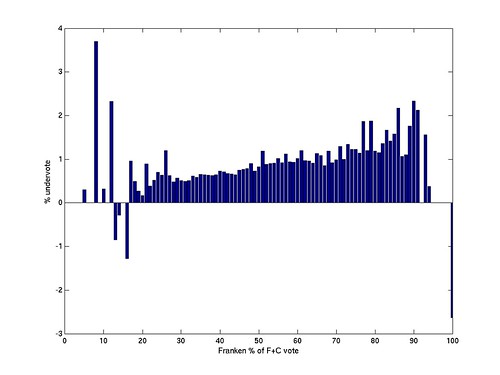
The third figure shows the proportion of undervotes relative to the total number of votes for president in that precinct:
What does this mean? Honestly, I don't know. I think it demonstrates that Franken is unlikely to benefit by thousands of votes, but then again, he doesn't need to.
There were more undervotes in Franken-friendly districts, but not by a huge margin. If every undervote were turned into a counted vote (which is impossible, as a large number of people intentionally cast no vote for Senate), and these newly counted votes were allocated only to Coleman and Franken, exactly along the same proportion as the rest of the precinct, this would only result in 13286 new Franken votes and 11570 new Coleman votes, resulting in a +1716 change for Franken. But only a small percentage of undervotes were unintentional; to tip the election to an exact tie, about 1 in 8 estimated undervotes would have to turn into a newly counted vote during the recount.
But that's making a lot of sketchy assumptions. There's really not enough information here to say anything about the undervotes with any confidence. There is certainly no evidence of any systematic miscounting or other monkey business, and it may show nothing more than voters in Franken-friendly precincts were more likely to not vote for Senate. My gut feeling is that the data shows that a Franken win due to freshly counted undervotes is a possibility, but just barely.
* Undervotes are an estimate; the estimate is the number of votes counted for President minus the number of votes cast for US Senate.
** Because there was a significant third-party vote in this race, I categorized the data based on Franken's percent of the total votes cast for Franken or Coleman. That is, the 50% mark means ballots were cast in even numbers for Franken and Coleman, regardless of the number of ballots for Barkley in those precincts.
update: I just found a page on the MN SOS site that lists the total number of ballots cast as 2919013. This means the total presidential undervote is currently 8802. Because this would cause my numbers to be a little low, we can compare that number against my estimate of total Senate undervotes, 24856. So we might expect the true number of Senate undervotes to be up to 35% higher than my graphs show. I can only guess because the number of ballots cast in each precinct is not currently available in a machine-readable format.
