When I diaried last week that we were in the midst of the biggest deflation since the Great Depression, I was met by a number of naysayers. One said I was a "chicken little" although regular readers of my diaries know that I'm anything but that. In point of fact, I have never said we were in or necessarily going to have "Great Depression 2," although for the last year and a half I have used the meme of a "slow motion panic".
A large number of others, however, criticized the diary on the grounds that the deflation was just the artifact of the collapse of the Oil bubble. We are undergoing deflation because of the decrease in Oil prices, they wrote, nothing more.
That is not the case. We are undergoing a real deflation for the first time in over 50 years because consumers are full of debt and tapped out of cash, their assets (homes and stocks) are going down in price, and they are unable or unwilling to spend the money they have begun to save at the gas pump. With consumers not buying, demand for manufactured goods has cratered as well. I'll show why below the fold.
Cross posted at The Economic Populist
If the critics are right, then a serious reduction in the price of Oil, especially back in the 1980s when our manufacturing was less efficient, should have given rise to deflation then as well. With that in mind, here is a graph of Oil prices year over year since 1981:
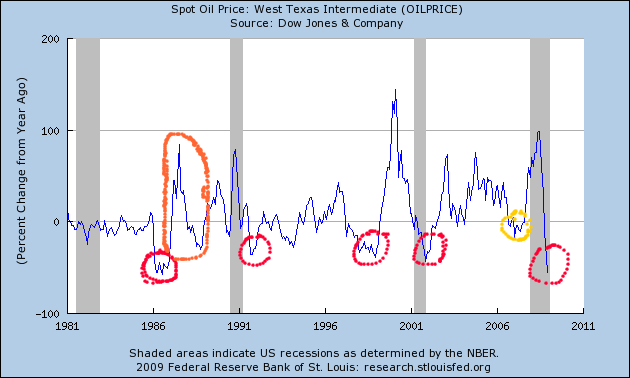
As of December 2008, the monthly reported price of Oil fell to $41 from its high of $139 in June and July, a decrease of 69.3%. [Note: all of the figures and percentages in this diary are from the data reported monthly by the St. Louis Fed.]
But as the above graph shows, that isn't the only time Oil prices have declined dramatically. Look at the red circles: from October 1990 to September 1991 they declined 39.2%. From November 1997 to August 1998 they declined 37.2%. From November 2000 to November 2001 they declined 42.8%.
In 1991, 1998, and 2001, despite the signficant declines, there was no deflation. Inflation over the same periods was +2.8%, +1.1%, and +1.9%. By contrast, by October 2008 Oil prices had declined a similar 42.6%, and there was already a deflation of - 1.5%.
And in the granddaddy of all prior declines, from November 1985 to July 1986, Oil prices declined 62.4% -- almost as much as in 2008! So what was the inflation rate during that period? +0.4%. There was no deflation whatsoever in response to a 62.4% decline in the price of oil! To the contrary, consumers refinanced debt at lower interest rates, and there was a modest housing boom.
[The yellow circle indicates when, in response to a mild 26.6% decline from August 2006 to January 2007, there was a significant decline in CPI of - 0.5%, a harbinger of our current deflationary recession.]
But, you might say, on those occasions there was no previous large spike in prices. And that is where the orange oval in 1987-88 comes in. In 1987, Oil prices spiked 85%. Then in 1988 they declined 30%. During that period of time there was not a single negative number in inflation, and during the 1988 oil decline, consumer prices increased 4.2%
Contrast that with a deflation of - 4.4% -- the most since the 1930s -- during the last 5 months of 2008.
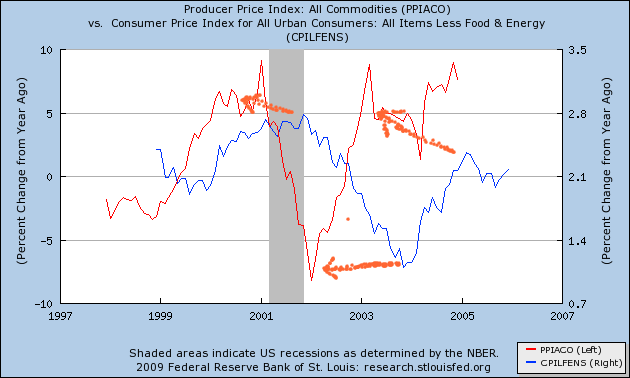
In a separate vein, my friend Bonddad suggests that this may not be a "true" deflation vs. a commodity bear market, because core inflation hasn't declined that much yet. The problem with this reasoning is that core inflation actually lags headline inflation by about a year, as energy prices in particular make their way through the system. To give you an example, here is the 2001 recession. Notice that commodity prices (the red line) both peaked and troughed over a year in advance of core CPI (the blue line):
Similar examples from the 1960s and 1970s exist, but I won't bore you with yet another graph on that score.
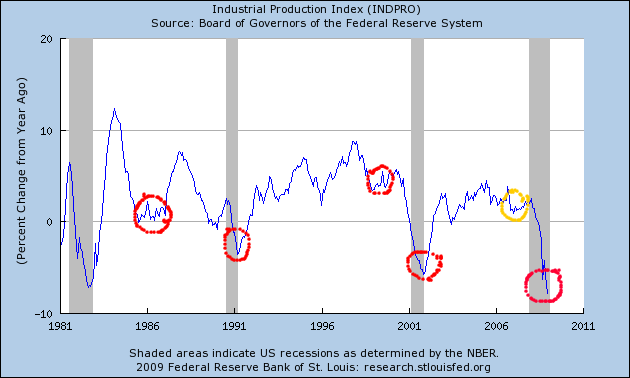
What makes our time so different is the breadth and scope of the general economic weakness. As the graphs below show, in 1986, 1998, and 2006 there was no recession at all.
Moreover, the 1991 and 2001 recessions each featured pockets of strength. In 2001, industrial production suffered:
and unemployment spiked:
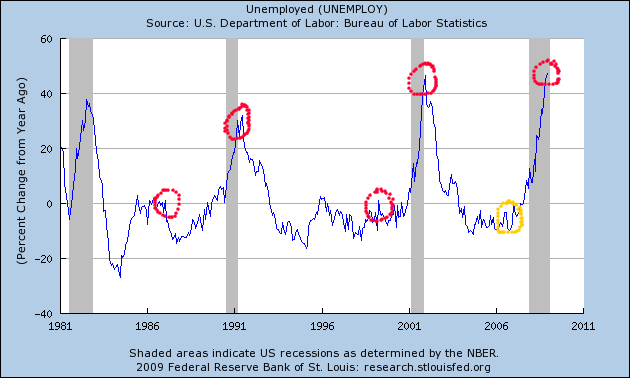
But in the 1991 recession, as the above graphs show, manufacturing remained relatively strong, and there was a less intense spike of unemployment.
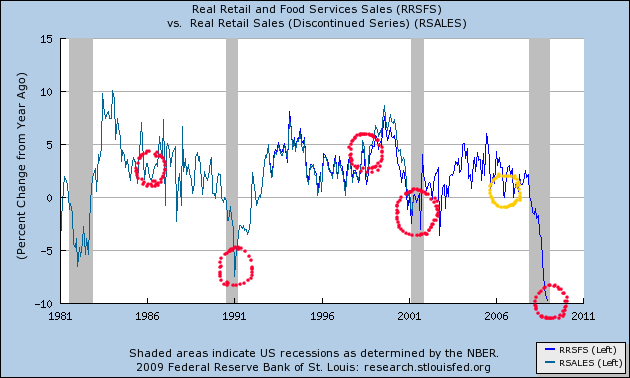
Contrarily, in the recession of 1991, it was the consumer who folded, as retail sales tanked:
as did housing starts:
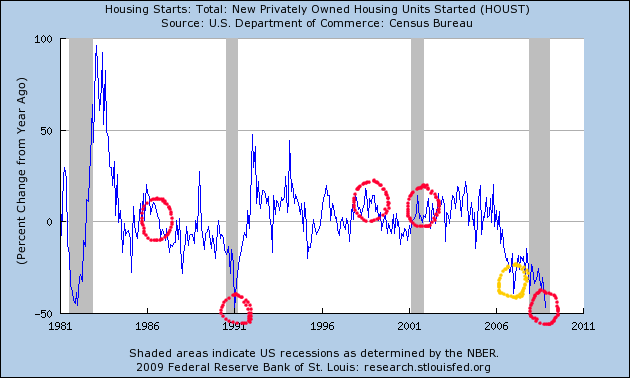
But in the 2001 recession, retail sales declined modestly, and housing starts showed no signs of distress!
What is different about this recession is that all elements of the economy -- industrial production, retail sales, unemployment, and housing -- are all showing dramatic declines. There is nowhere to hide. Which is why the now nearly dailystories of wage cuts are so worrisome. The scope of the collapse of Oil prices, while partly due to a bubble bursting, is even moreso a manifestation of that universal and global downturn in consumer demand and producer confidence -- the symptom of pandemic overindebtedness -- which is why I believe that by mid-year we are likely to see year-over-year deflation of more than - 3.0%.
The Deflationary Recession of 2009 is more than just Oil. It is an old-fashioned 19th Century style decline, that has unfolded in slow motion, just as I predicted a year and a half ago.
