The BLS reported this morning that new jobless claims declined to 601,000 in the last week. That is the lowest weekly report since January. The 4 week moving average also declined to 637,000. According to the research reported by Prof. James Hamilton, as he said last week, "That ongoing drop in the 4-week average is noteworthy because in each of the last 5 recessions, once the new claims number began declining from its peak value reached during the recession, the NBER subsequently dated the recovery from that recession as beginning within 8 weeks." This week's decline increases the likelihood that the recession is very close to bottoming to more than 50%.
The continuing weekly decline in weekly jobless claims is not the only indication that the recession may be close to bottoming out. More below the fold.
Last Friday the ISM Manufacturing Index for April was released. It was all but ignored in the economic blogosphere. It shouldn't have been.
Along with auto sales, it is one of the very first economic releases for the month of April. Also crucially, it is a leading economic indicator. The ISM Manufacturing index has typically bottomed a median 2.5 months (a mean of 4) before the end of post WW2 recessions. The latest it bottomed was the month of the end of the recession, the earliest 9 months.
In other words, this is an early indicator with a long and successful track record.
So, why does the NAPM's Manufacturing Index suggest the bottom of the recession is near? As shown in the graph below, in April, the Index rose to 40.7, after bottoming at 32.9 last December:
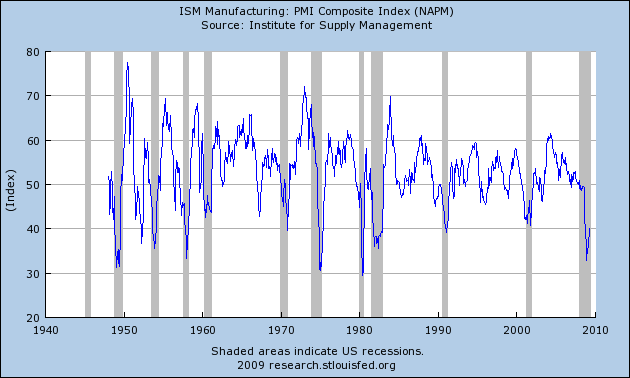
In other words, the index has already risen 4 months since bottoming, more than the median time until the end of a recession. Further, the median reading of the index at the end of post-WW2 recessions has been 40.9 - 41.0 (as opposed to 40.7 in April). A reading over 41.2 for several months usually means economic expansion. The median improvement of the index from recessions' bottom until recessions' end has been +4.6 - 4.7 (we are up +7.8 in the last 4 months). The biggest "false dawn" was an improvement of +6.1 in 1970.
In summary, the NAPM Manufacturing index's reading for April is consistent with the recession bottoming out, and a recovery beginning almost immediately.
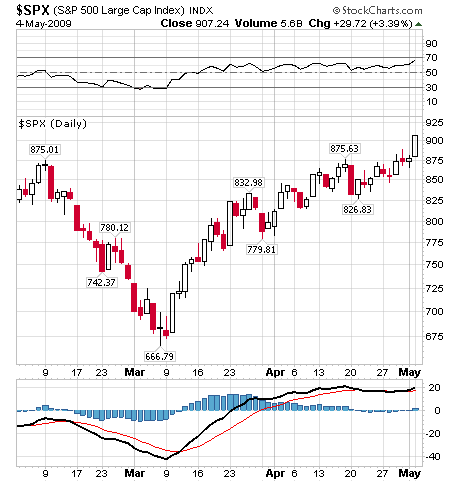
While auto sales for April disappointed, and real residential improvement for the first Quarter of 2009 continued to stink, the NAPM index isn't the only leading indicator that has switched to a positive reading. The S&P 500 stock index, measured over the 3 previous months, is also a leading indicator for the economy as a whole. This has turned positive (i.e., it was higher on May 1 than on February 1) for the first time since Black September:
Furthermore, financial stocks tend to lead the S&P index. Since Obama's inauguration on January 20, the financial index (blue) has almost always outperformed the broader market:
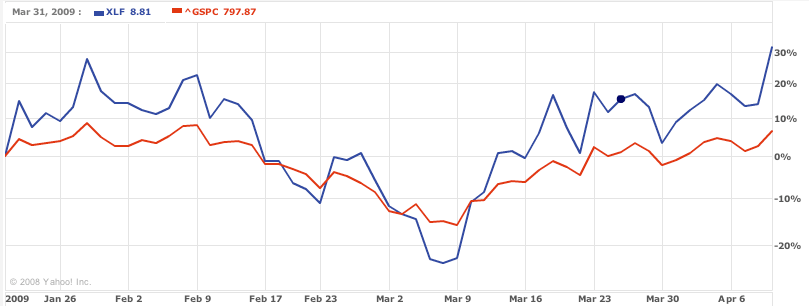
(the graph above is a few weeks old. The situation has only improved since then.)
Consumer confidence about the future (yellow in the graph below) is also at the highest it has been, bar one month, in almost a year.
The crucial element to any turn is still going to be housing, specifically, a bottom in new home sales. That has still not broken out of its trend of declining to zero(!) by early next year:
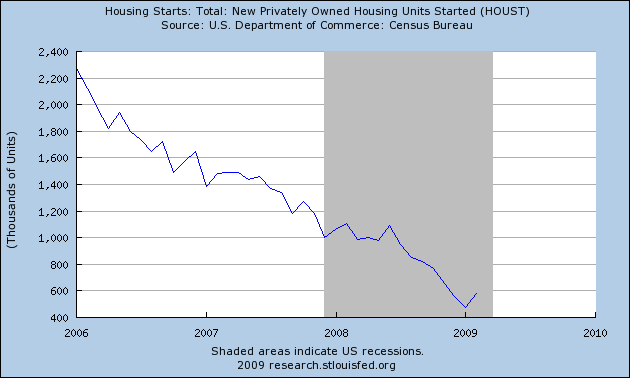
When it does, that will probably be the actual marker of the end of the recession.
That being said, while the NBER may ultimately date the end of this recession from June or July of this year, that doesn't mean that the middle/working class pain will end. Regardless of whether the economy as a whole begins to improve, the malaise of working and middle class America will not be relieved until wages increase, and employment rates return to a robust level.
The news on that score is grim. Unemployment is a lagging indicator. Historically, it continued to rise right through to the end of recessions. The "jobless recoveries" from the 1990 and 2001 recessions were even worse: unemployment continued to rise for over a year after both recessions ended!
If unemployment follows the same pattern this time as in the last two recoveries, here is what its graph will look like for the next 3 years:
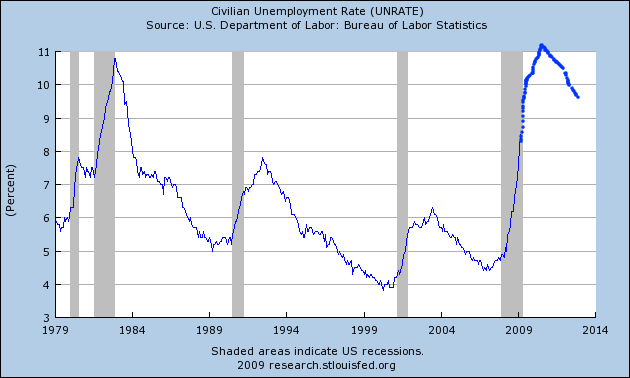
Unemployment rises to 11.3% by December 2010, and then takes until early 2012 just to decrease back to 10.1%.
Note this is U3 unemployment, so U6 unemployment will be correspondingly worse. April's unemployment rate will be reported tomorrow. I expect the official U3 unemployment rate to increase to ~8.9%
