There has been a lot of discussion about a graph showing partial vote returns that Andrew Sullivan posted on his blog.
Looking at the underlying numbers, nothing seems unusual about vote returns, making this line of criticism seem invalid. This does not however, rule out the possibility of fraud.
**Crossposted at StochasticDemocracy.com**
**Crossposted at StochasticDemocracy.com**
There has been a lot of discussion about a graph showing partial vote returns that Andrew Sullivan posted on his blog.
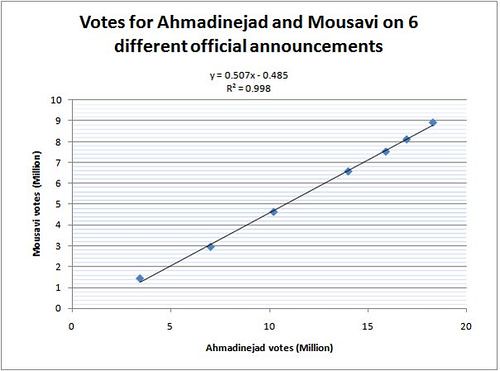 Yes, this obviously was a "divine assessment". They didn't even attempt to disguise the fraud. Which, to me, tells me they panicked. This graph is a red flag to Iran and the world.
Is this so unusual? I thought that looking at raw vote totals might make things look artificially fishy.
After some searching, the original data source turned out to be from here. From there, a graph of vote-share can be created:
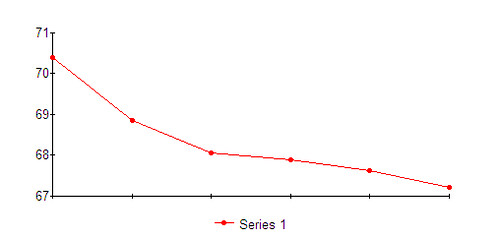
Considering that 20% of returns had already come in by the first data point, this doesn't seem unusual at all.
I don't have any raw data lying around, but HudsonValleyMark ran a "simulation" of vote returns from an election dataset, finding similar amounts of variation.
Real data would be preferable, and if anyone has any data of real-time election returns out there, please share them in the comments. (I actually have some at home, because I worked on real-time election projection for my blog. But, I'm in Europe at the moment, so that it isn't too useful...)
This doesn't rule out election fraud of course, it only suggests that other avenues should be explored. I'm trying to find regional vote data, to see if I could use something some more traditional data-verification tools (Benford's law, etc). My knowledge of Iranian data sources is limited, so any help in this direction would be greatly appreciated.
Update: See Nate Silver
**Crossposted at StochasticDemocracy.com**
