This is the next in a quasi-weekly series of diaries on the Northern Hemisphere Arctic sea ice melt season. I write these in memory of Johnny Rook, who passed away earlier this year. He was the author of the blog Climaticide Chronicles.
I missed you all last weekend; had an unanticipated cross-country trip to visit a sick family member, who I can happily report is on the mend and at home now, up and about.
In any case, pictures. Here's Nome AK at 8:59 a.m. their time today:
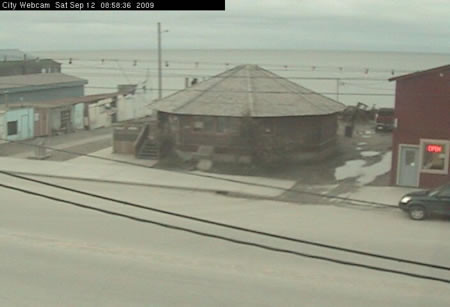
Weather in Nome AK at 15:53 UTC (8:53 a.m. ADT): Temp. 41°F, Dewpoint 35°F, wind NW at 6 mph; weather is mostly cloudy.
More below.
Current Arctic Sea Ice Conditions
The usual arctic sea ice extent time series graphic, but with the ±2 standard deviation from the mean, and 2005's time series of arctic sea ice extent, is shown below; this goes from 1 June through 30 October for the periods indicated in the legend in the lower left of the graphic.
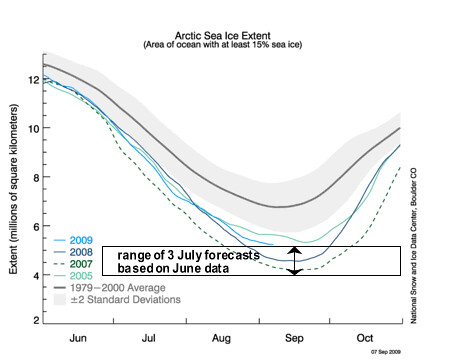
The week of 4 September 2009 saw the sea ice extent decrease to a level just below 2005's sea ice extent minimum. On 12 September, we're about 50,000 km2 below that minimum at about 5,255,000 km2. I think it's unlikely that sea ice extent will drop much further from this point, though the last 3 days have seen a drop of 20,000 km2 per day. We'll likely touch the highest of the forecasts made in early July for minimum sea ice extent, which were based on the June sea ice extent activity and trends; that would be at 5.2 million km2.
Over the past week, sea ice concentrations have changed from 9/4/09 to 9/11/09 as shown below from left to right.
| 4 Sept 2009 | 11 Sept 2009 |
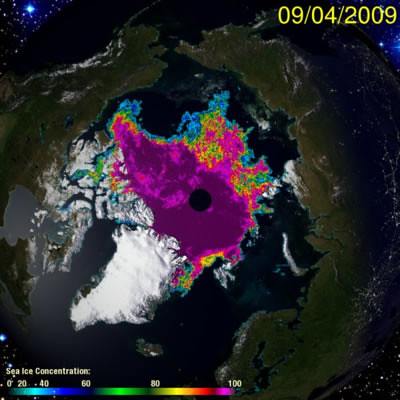 | 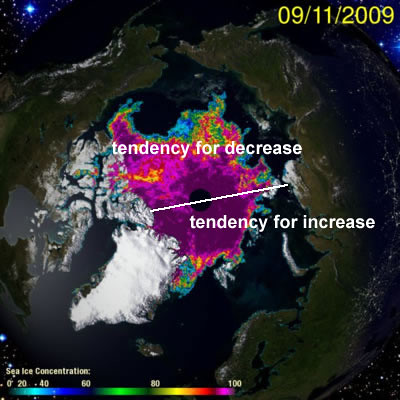 |
There has been a general tendency for sea ice concentrations to have decreased over the past week in the area above a fairly arbitrary line I've drawn in the 9/11/09 graphic, and to have increased below that line.
August 2009 in perspective
The time series of mean August sea ice extent is shown in the graphic below, along with a linear trend line.
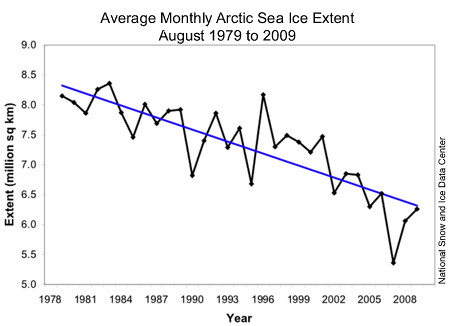
August 2009 had the 3rd lowest mean sea ice extent after 2008 and 2007, and was only 40,000 km2 above 2005, now the 4th lowest August. It could be argued that a better function to fit the long-term trend might be a quadratic; and in fact a quadratic fits the date better, for at least the 31 Augusts we have here (linear explains 63.6% of variance, an "x2" function shows the trend steepening and explains 70.1% of variance).
According to the National Snow and Ice Data Center, the large scale atmospheric flow over the Arctic basin led to the spreading out of the ice pack, resulting in increased areal coverage (remember, only 15% coverage counts within a 25 km2 area). Given the large amount of "young" (i.e. 1st year) ice which is at least 1 meter thinner than multiyear ice, it's unlikely that the volume of sea ice this August was significantly more than that of last August.
What's Next?
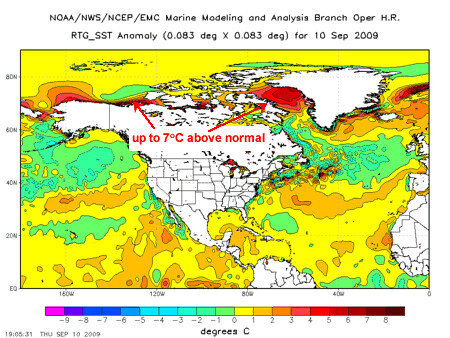
Sea surface temperatures away from the sea ice continue to be above normal, as one might expect with so much of the sea surface exposed to solar radiation (and with the solar angle of about 45° on average, about 90% of the incoming radiation getting absorbed, whether direct or through clouds).
The NOAA Marine Modeling and Analysis Branch (MMAB) does a 1/8° by 1/8° sea surface temperature (SST) analysis based on a blend of infrared sensors on satellite, plus surface buoy observations. The western quadrant of the Northern Hemisphere is shown below. We see temperatures as much as 7°C above normal poleward of the Canadian Northwest Territory and between Baffin Island and Greenland (Davis Strait). Warmer than normal waters are also north of AK (up to 5°C).
In the eastern quadrant, SSTs of as much as 8°C above normal can be found in the Kara and Barents Seas north of central Siberia, and between Spitzenberg and Greenland (the Fram Strait).
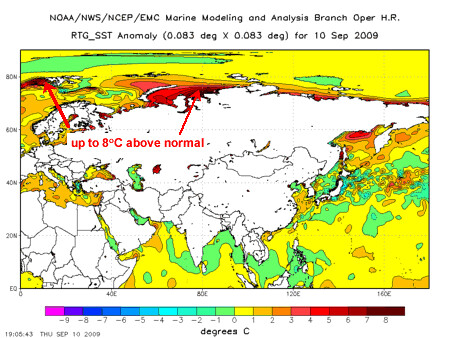
All this ocean heat content will have to be dissipated before we can get back to a normal ice cover; once again, lots of new 1st year ice will form, that will be subject to rapid loss through either melt or winds pushing that ice around into warmer waters next melt season.
Weather conditions in the Arctic are shown in the graphic below, courtesy of the University of Cologne, Germany (my usual source). I've contoured every 3°C from 0°C down. Additionally, I've added labels for time of day; this graphic is an analysis from 06 UTC 12 September 2009. It's afternoon in the Asian sector of the Arctic, morning in the European sector, and nighttime over the North American sector.
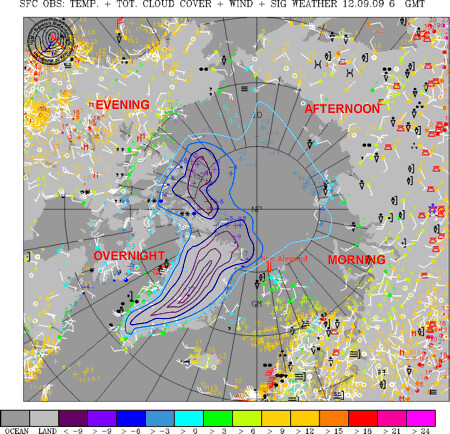
When will the sea ice minimum occur? Climatologically, it typically happens right about now. I don't expect much different this year, so we're likely either already there or within at most 100,000 km2 of it. How low will it be? Not that I'm an expert, but I can't see a scenario of sea ice extent dropping below 5.1 million km2 this year, if for no other reason it's getting cold up there now where there is ice cover (temperatures as low as -10°C near Greenland on the sea ice), as the solar insulation disappears for the polar night. This will represent the 3rd lowest value in the existing satellite record, and arguably, from reconstructed records from the past, the 3rd lowest since 1880.
Next weekend might be my sea ice minimum diary ... we'll see.
