http://www.guardian.co.uk/...
Revealed: the secret evidence of global warming Bush tried to hide
Photos from US spy satellites declassified by the Obama White House provide the first graphic images of how the polar ice sheets are retreating in the summer. The effects on the world's weather, environments and wildlife could be devastating ..
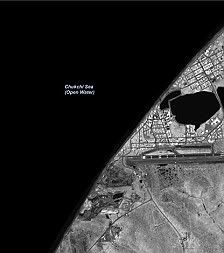
One particularly striking set of images - selected from the 1,000 photographs released - includes views of the Alaskan port of Barrow. One, taken in July 2006, shows sea ice still nestling close to the shore. A second image shows that by the following July the coastal waters were entirely ice-free.
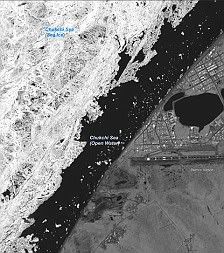
Enlarged image here
No, one can't draw conclusions from two photos.
But why did the Bush Administration sequester these images?
Of course, the big number we all watch is CO2.
Projections of concentrations of this gas dominate the discussion.
The pictures above illustrate a desire on the part of the Bush administration to suppress information from reaching the public. One need not do an analysis of potential impacts and data to know that images like those above are alarming enough.
But let me divert the discussion to discuss something more alarming than just what those photos illustrate.
-----------------
In the mid 1980s, scientists were already looking atmospheric methane levels.
http://www.sciencedirect.com/...
We have constructed a record of atmospheric methane (CH4) over the last 10,000 γ which shows that CH4 has increased to more than double the natural levels of a century ago.
Our observations and calculations show that the concentrations of CH4 remained virtually unchanged over thousands of years until about a few hundred years ago. Until the beginning of the 18th century there is no evidence of significant trends. Between 1700 and 1900 CH4 increased slowly at an average rate of about 1.5 ppbvy−1, between 1900 and 1925 CH4 increased by about 2.2 ppbvy−1, between 1927 and 1956 by 6.4 ppby y−1, between 1962 and 1973 by about 11 ppbvy−1 and during the last decade it has increased at a rate of about 17 ppbvy−1. We explain these rates of increase by a global mass balance model. In the model, the increase of emissions from sources affected by human activities is taken to be proportional to the population and the atmospheric lifetime of CH4 is taken to be increasing if human activities are slowly depleting OH radicals that remove CH4 from the atmosphere.
Definition from the IPCC:
Radiative forcing.
The radiative forcing of the surface-troposphere system due to the perturbation in or the introduction of an agent (say, a change in greenhouse gas concentrations) is the change in net (down minus up) irradiance (solar plus long-wave; in Wm-2) at the tropopause AFTER allowing for stratospheric temperatures to readjust to radiative equilibrium, but with surface and tropospheric temperatures and state held fixed at the unperturbed values.
In plain English, the term "radiative forcing" is a useful way to compare different causes of changes in the world's climate system.
Due to methane's short half life in the atmosphere, the radiative forcing of the greenhouse effect is most prominent for the early part of its life cycle, the first 8 years or so using the current model of how methane is broken down in the atmosphere. During this period, it's potential as a GHG is 25 times that of CO2. It's important to note that methane breaks down into CO2 and water vapor, both of which continue to act as radiative forcing agents.
It is estimated that one third of the radiative forcing ["Global Warming"] that has happened so far is due to the increase in methane in the atmosphere.
Of some interest, up until now it is estimated that one third of methane produced is from farm animals, either through waste or exhalation of ruminants. Contrary to some popular news reports, plants do not add any appreciable amount to the methane load.
Here's another extrapolation of that data.
There is some question of the concentration of reductions in the atmospheric hydroxyl radical OH, which helps break down methane.
The hydroxyl radical is often referred to as the "detergent" of the troposphere because it reacts with many pollutants, often acting as the first step to their removal. It also has an important role in eliminating some greenhouse gasses like methane and ozone.
Are reductions in atmospheric OH a direct cause of increased methane levels?
http://www.guardian.co.uk/...
http://www.scientificblogging.com/...
http://web.mit.edu/...
(See below for a startling 'revelation' about why OH levels are lower.)
Since the mid 1980s scientists were reporting that methane levels were increasing dramatically relative to levels of the early 1900s. While CO2 levels have been increasing, the delta in methane concentration has increased at much steeper rate. There was an anomaly in the early 2000s, where methane levels appeared to have leveled off. However, data from the last three years now show a big uptick in atmospheric methane levels.
Methane is sequestered in huge amounts in the permafrosts of the Northern hemisphere; the Arctic is experiencing the most profound changes in temperature as a result of radiative forcing. The increase in levels of methane being observed could as a result of melting of the permafrost, as stated in a previous diary. Reductions in the hydroxyl radical OH may be an attendant side effect of the increased methane, which may form a feedback loop on its own.
http://www.giss.nasa.gov/...
The models used in the new study show that when you greatly increase methane amounts, the OH quickly gets used up, and the extra methane lingers for hundreds of years, producing enough global warming to explain the LTPM climate.
http://www.dailykos.com/...
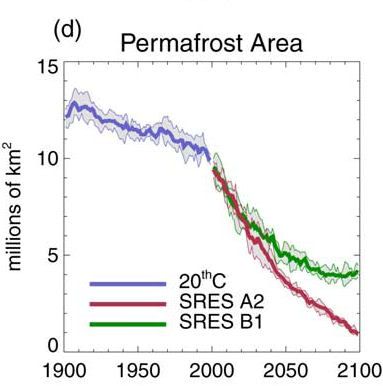
There are indications that the SRES A2 part of the graph is optimistic; we are clearly on a path to melting of permafrost areas at a much higher rate, which releases yet more methane and increases the overall effect of climate change. Something appears to have reached a critical point in the mid 2000 decade, and yet another new feedback started affecting methane levels.
So, we now have a hypothesis for two attendant feedback loops for increased methane working simultaneously. One is the increased production of methane itself from melting permafrost areas, the second mechanism is the reduction on hydroxyl radicals, the 'detergent' which helps to break down methane.
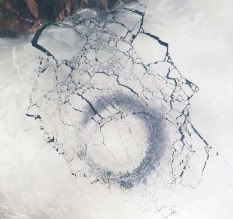
Late in April 2009, astronauts aboard the International Space Station observed a strange circular area of thinned ice in the southern end of Lake Baikal in southern Siberia. The ice ring had a diameter of 2.7 miles (4.4 km). Credit: NASA
There were two of these circles noted from space:
See this image and look for the arrows.
http://i.livescience.com/...
A blog 'discussion' of the causes for these circles includes some interesting photos.
--------------
And yes, one may ask how does the 2nd part of my diary fit with the 1st part?
While it is unlikely the Bush Administration understood or knew much of what the pictures at the top of the diary represented, other than a challenge to the narrative of "don't worry, go shopping, spend money", I have to wonder what other information has been blocked from distribution the past 8 years.
Could we have taken action to stop this cycle, if we had a few extra years warning?
We'll never know, of course.
