The advanced estimate of 4th Quarter 2009 GDP has just been released, indicating that the economy grew at a rate of 5.7% in the last three months of last year. While 3.4%of that was related to the restocking of very lean inventories (meaning 2.3% was not, which ain't bad), it is well to remember that, regardless of the source of GDP growth, whenever YoY GDP growth has been in excess of a little more than 2% a year, it has always indicated job growth. In the year 2009, the initial estimate is that economy grew at a rate of 0.8%. I’ll show you the very tight correlation between GDP growth and job growth below, as well as why it is very likely that this quarter - the first three months of 2010 - the economy is growing at a rate in excess of 2%.
UPDATE: Bonddad thinks it is a great report.
-----
In several prior diaries, I have discussed "Okun's Law," which is an economic rule of thumb that for every 2% change in GDP, there is a 1% change of unemployment in the same direction. As a corrolary of that rule, if you take the year-over-year percentage rate of GDP growth, and subtract two, that should give you, roughly, the percentage of growth or contraction of jobs.
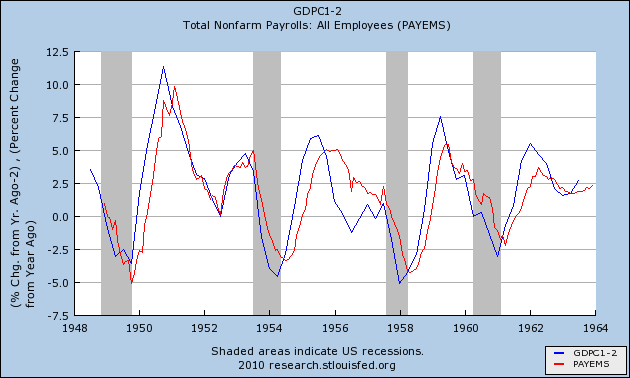
In the graphs below, I have made use of this corrolary where the blue line represents GDP growth minus 2%, for example, 2% YoY GDP growth - 2% = 0% on the graph. The red line is YoY nonfarm payrolls, on the same scale. Here is the immediate post-WW2 period:
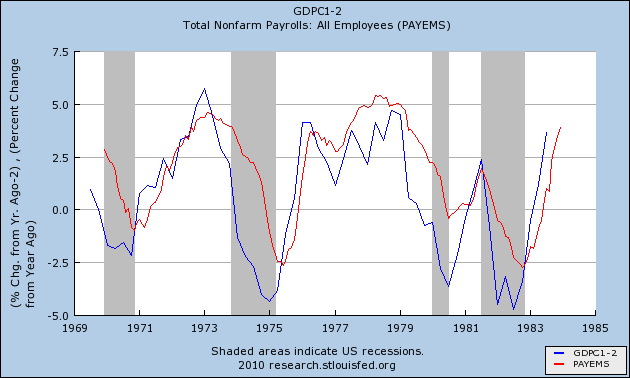
Here are the 1970s and early 1980s recessions:
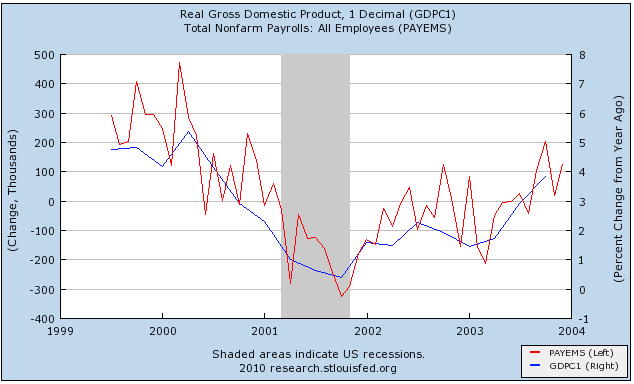
Here is the era of "jobless recoveries" up until the present:
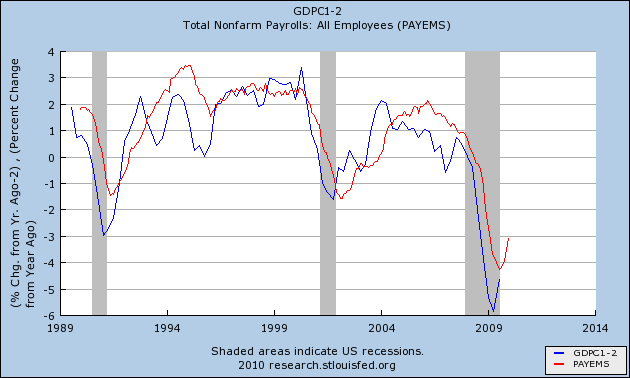
Notice how well the red line tracks the blue line, and how peaks and troughs are typically ~2% or less apart.
Here is GDP for the 4 quarters of 2009:
-6.4% (Q1 2009)
-0.7% (Q2 2009)
+2.2% (Q3 2009)
+5.7% (Q4 2009)
Thus, for the entire year, GDP was +0.8%.
In the graphs above, the red line is for YoY payrolls. The actual bottom in payrolls is somewhere in the middle of the year where YoY growth = 0%. Beginning with the 1948 recession, here is the number of months after troughs in jobs and YoY GDP growth in excess of 2% (in descending order, in months):
( - 9)( - 8) ( - 6) ( - 5) ( - 4) ( - 4) ( - 3) ( - 2) ( - 2) +7
In case you weren't sure, the +7 outlier is the extremely weak "jobless recovery" of 2002-2003 where YoY jobs didn’t go positive until 7 months after YoY GDP hit 2%. In all other cases, including the 1992 "jobless recovery", jobs were added first.
About the "Blip"
Both Prof. Paul Krugman and Calculated Risk have called the good GDP reading a "blip" that can be attributed to inventory restocking. The implication for the blogosphere being, of course, that it will momentarily pass and we will be back in negative GDP pronto, even though that is not what either are saying. Krugman thinks the odds against. a double-dip are 60%- 70%. CR sees 1% to 2% growth. As indicated above, Q4 2009 GDP grew at 2.3% even without restocking. Their template is the temporary bounce following the 1980 recession which promptly resolved into the very deep 1981-1982 recession.
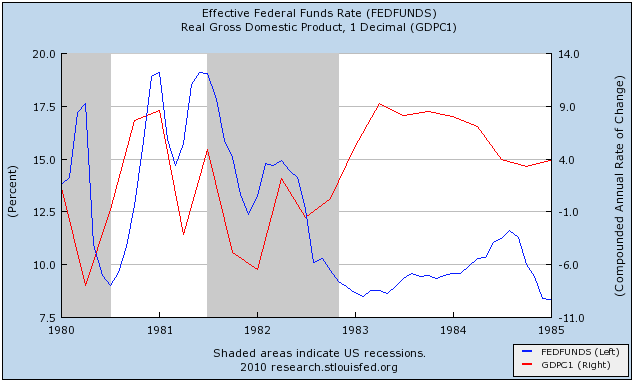
While GDP is likely to subside, the double-dip after the 1980 recession has a very simple and straightforward explanation: Paul Volker of the Fed raised the Federal Funds rate from 9% ti 19% in 6 months, effectively killing the economy and employment in order to kill inflation. Here's two graphs showing it. In the first, the Fed Funds rate is in blue, and the GDP in red:
In the second, the same Fed Funds information is in blue, and jobs are in green:
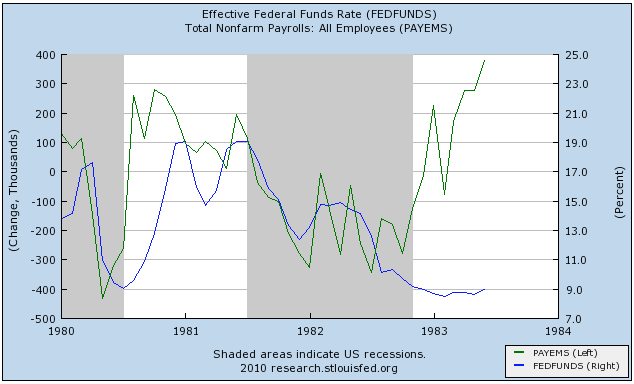
Like I said, the Fed doubled interest rates and killed both GDP and employment. Unless the Fed does the same sort of thing in the next couple of months, a repeat performance is very unlikely. It's true that inventory restocking will enhance GDP readings, but that is commonplace at the beginning of economic expansions. Take a look at this graph of annualized GDP growth from 1980 to the present:
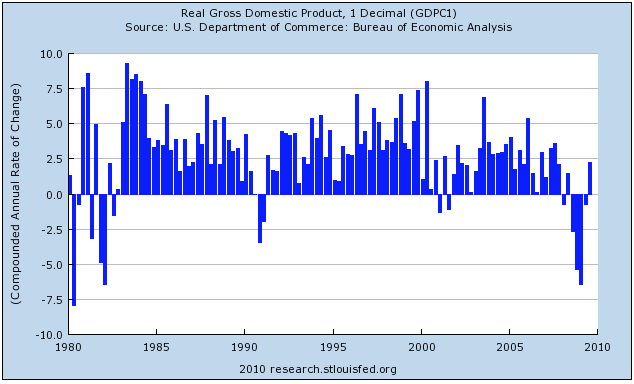
The graph shows Krugman's exemplar "blip." Notice that there were several quarters of actual job growth afterward. Compare this with what happened after 1982 -- there is a full year of +7.5% GDP growth from early 1983 to early 1984, that slowly tails off thereafter. Contrast this with the lackluster GDP growth of under 3% in the first 3 or more quarters after the end of the 1991 and 2001 recessions.
The Outlook for Early 2010
The quick growth of Industrial Production of the last 6 months shows that this economic expansion has much more in common with the 1983 expansion than the 1992 and 2002 ones. Yes,strongly positive GDP will subside as inventory restocking fades, but that by no means foretells a double-dip.
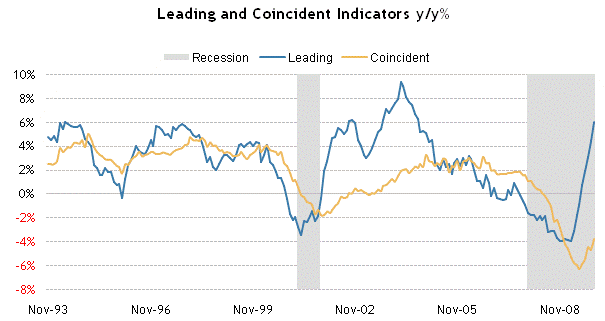
Indeed, on a year-over-year basis, with the exception of 2003 the Leading Economic Indicators are more positive at about +6.5% to 7% than they have been at any time since the mid-1980s, as shown on this graph that is current through November:
The simple fact is, the first 3-6 months of this year are probably going to show growth, and indeed more strong growth than few dared to hope for in 2009.
What does this mean about JOBS?
Assuming the worst case scenario (of 2002-03), if 1Q 2010 is 2.3% or more higher than 1Q 2009 GDP, YoY payrolls will show no losses by August 2010, suggesting a trough in February or March. Under any other scenario, jobs are at their trough now (or revisions will show that we are already past it). Blip or no Blip.
As I said above, the extremely close fit between % changes in GDP and % changes in jobs on a year-over-year basis. Generally speaking, take the YoY %age change in GDP, subtract 2, and you are probably within a percent or two of the YoY % change in jobs, with a lag of a few months.
But the YoY change doesn't tell us about when we begin to add jobs coming out of a recession. For that we need to compare changes in GDP with monthly gains or losses in payrolls, which is what I've done below.
First, let's look at a graph of the 1992 "jobless recovery." YoY GDP is in blue (right scale, note I am not subtracting 2 in this graph), monthly gains/losses to payrolls is in red (scale to the left, in 1,000s):
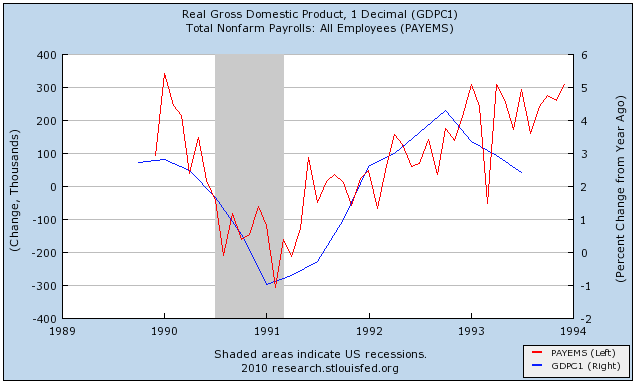
Once YoY GDP turned positive in 4Q 1991, there was only one more month in 1991 and one in 1992 where jobs weren't added to the economy.
Next is the very lackluster "jobless recovery" of 2002-03:
The offshoring of manufacturing was in full swing by this time, and only 3 months of 2002 showed job gains (June, October and November) while GDP was positive over 1% throughout, reaching a YoY gain of just under 2.3% in 2Q 2002. Once YoY GDP hit 2% consistently beginning in 2Q 2003, jobs finally were added to the economy on a consistent basis.
Finally, here is the "Great Recession":
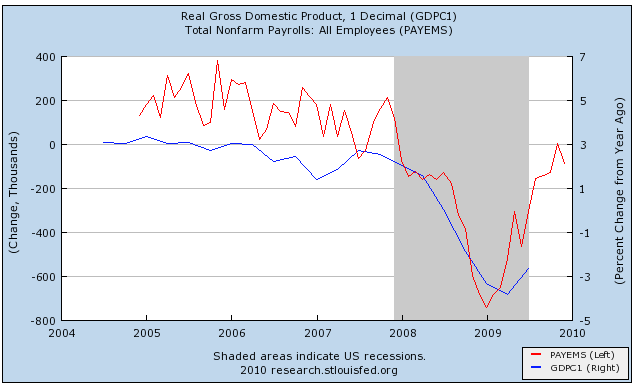
We learned this morning that 4Q 2009 GDP was 5.7%, giving us a YoY GDP of 0.8%. The Leading Economic Indicators virtually guarantee another good GDP number for Q1 2010, making it very likely that we will have YoY GDP in excess of 2% this quarter.
Strictly going by the GDP, if the economic expansion is more like 1992, we are going to start adding jobs consistently now. (Based on increases in industrial production, retail sales, and declining layoffs, I think this is more likely). At Briefing.com, the consensus if for +50,000 payroll growth in January when that number is reported next week. Contrarily, if the expansion is more like 2002, we are going to add jobs sporadically in some months and not in others.
What everyone is watching is sustainability. If gas prices go up too much, or as the effect of last year's stimulus plan begins to wane, can gains be sustained? And noboby is talking about declining unemployment yet. On that, the jury is very much out.
