We live in Epic Times.
For nearly the last Million years, CO2 levels in the Atmosphere, stayed mostly below 300 ppm (parts per million).
Well those happy days are apparently over.
Welcome to the New Normal!
CO2Now.org
Earth's CO2 Home Page
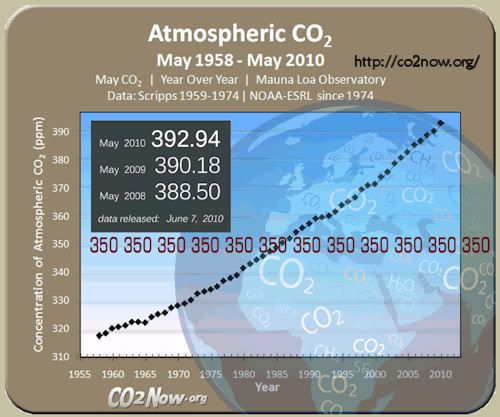
Atmospheric CO2 for May 2010
392.94 ppm
larger image
Preliminary data released June 7, 2010 (NOAA-ESRL MLO)
Well maybe 393 PPM of CO2 is not really that big of a deal?
CO2Now.org
What level is safe?
The upper safety limit for atmospheric CO2 is 350 parts per million (ppm). Atmospheric CO2 levels have stayed higher than 350 ppm since early 1988.
Well maybe that extra 43 ppm's is not really big enough to matter? (... we can hope.)
If we could stop CO2 at 393 -- the earth climate system might squeak by, with minimal disruption.
However given the momentum behind the Carbon Dioxide Growth trends, we most likely WON'T BE staying at these "New Normal" levels for long.
Acceleration of Atmospheric CO2
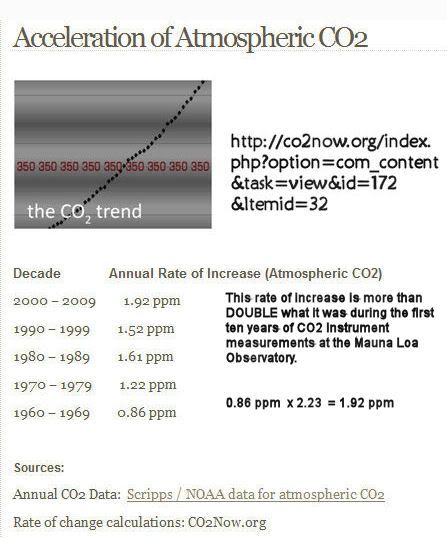
Atmospheric CO2 is accelerating upward from decade to decade. In the past ten years, the average annual rate of increase was 1.91 parts per million (ppm). This rate of increase is more than double what it was during the first ten years of CO2 instrument measurements at the Mauna Loa Observatory.
Decade Annual Rate of Increase (Atmospheric CO2)
2000 – 2009 1.92 ppm
1990 – 1999 1.52 ppm
1980 – 1989 1.61 ppm
1970 – 1979 1.22 ppm
1960 – 1969 0.86 ppm
Sources:
Annual CO2 Data: Scripps / NOAA data for atmospheric CO2
Rate of change calculations: CO2Now.org
the Rate of CO2 growth, IS INCREASING -- in other words it's Accelerating --
the "Truck just crested the ridge", and is SPEEDING DOWN the other side of the hill.
At more that TWICE THE GROWTH RATE, CO2 once had, not so long ago.
2.23 times to be exact, what the rate was, when Scientists started taking measurements:
0.86 ppm x 2.23 = 1.92 ppm (current annual growth rate, using decade averages)
that's nearly 2 PPM per year Increases NOW -- SO if nothing changes,
So the NEW "New Normal" for CO2 should be at least 410 PPM by 2020.
Here's the raw observation data from Mauna Loa, if you're interested:
Mauna Loa Observatory: Monthly Data 1958 - Present
Atmospheric CO2
Mauna Loa Observatory (Scripps / NOAA / ESRL)
Monthly & Annual Mean CO2 Concentrations (ppm)
March 1958 - Present
So maybe being in Hawaii, out in the middle of the Ocean, has effected those CO2 readings? There's not really many trees out there to absorb the CO2 -- (Note, however, the Ocean itself is one of the major Carbon-sinks on the Planet)
Here's some readings from another CO2 Tracking Station, far removed from those warmer climes:
Barrow, Alaska Observatory
Earth System Research Laboratory, Global Monitoring Division, NOAA
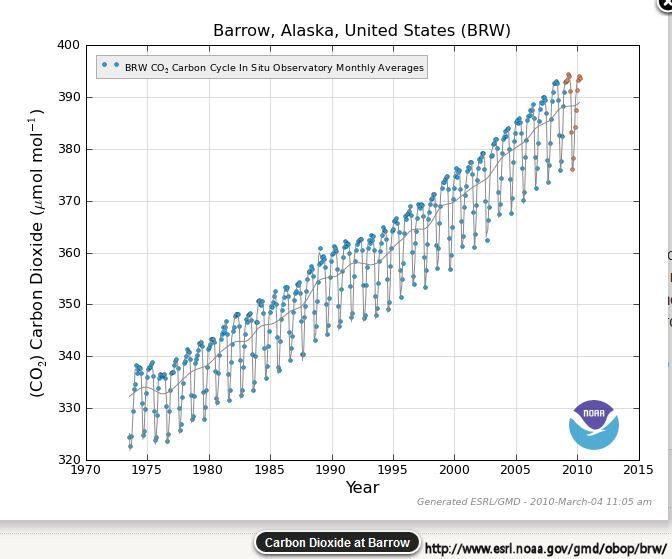
It seems the 2010 monthly readings [last few tan dots], in northern Alaska, are bumping around in the lower 390 zone too, just like their sister station, half a world away. Hmmmm?
Those 390 record CO2 levels could very well be what's behind the expected record Arctic Ice melt, shaping up for 2010, too? Could be.
We live in Epic Times.
But maybe all these PPM are really "too tiny to matter" -- they are Millionths of something after all? Non-techie minds, want to know ...
FAQ: Frequently Asked Questions -- Climate Science
New Scientist
Climate Change: A guide for the perplexed
Human CO2 emissions are too tiny to matter?
Good Question(s) ... the New Scientist has some good answers ...
Climate myths: Human CO2 emissions are too tiny to matter
by Catherine Brahic, NewScientist -- May 16, 2007
Ice cores show that carbon dioxide levels in the atmosphere have remained between 180 and 300 parts per million for the past half-a-million years. In recent centuries, however, CO2 levels have risen sharply, to at least 380 ppm.
[...]
Human emissions of CO2 are now estimated to be 26.4 Gt [giga-tons] per year, up from 23.5 Gt in the 1990s, according to an Intergovernmental Panel on Climate Change report in February 2007. Disturbances to the land - through deforestation and agriculture, for instance - also contribute roughly 5.9 Gt per year.
About 40% of the extra CO2 entering the atmosphere due to human activity is being absorbed by natural carbon sinks, mostly by the oceans. The rest is boosting levels of CO2 in the atmosphere.
that's a lot of tons, each year, since Giga is a Billion.
No wonder the Natural Carbon-sinks are starting to get saturated. Increasingly "Acidic Oceans" were our 1st Clue. Those Charts above, our 2nd Clue.
Humans produce an Unnatural Amounts of CO2 each year -- even much more than Volcanoes occasionally do! [see previous link for stats on the Volcano canard.]
We live in Epic Times.
The Earth's natural Carbon-sinks are starting to get saturated, or otherwise mismanaged:
CO2 Removal by Natural Sinks
[...] This implies a decline in the efficiency of the sinks in removing atmospheric CO2 over time (from 60% fifty years ago down to 55% in recent years), a trend expected to continue the future. Models suggest the sinks are responding to climate change and variability.
CO2 ocean sink
CO2 land sink
Imagine your garden, or your lawn, and how it can handle the sprinkler running for an hour or so, and absorb the water, quite well thank you very much.
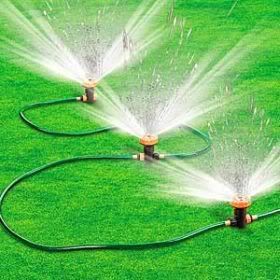
Now forget to turn off that sprinkler -- leave it running over night. What happens?
The garden, or lawn becomes saturated -- filled with more water than it can handle and process. The Excess Water, floods, and runs off into the nearest drainage, or likely the street.
Well this is what will eventually happen with CO2, if natural sinks keep getting too much "Sprinkling of CO2" annually -- they will flood, and run off into the nearest "Sky drainage" -- which would amount to even more acceleration in the annual CO2 growth rate.
Currently these Carbon sinks are capturing up to 40% of Human produced CO2. If nothing changes, that now-trapped amount (40% of those Gt's), too could be added to the Sky-Sewer overflow.
On a Geologic Time Scale,
Our New Normal, is anything BUT!
Scientists after analyzing Ice Cores around the world, after measuring the air content of trapped air bubbles in those ancient Ice Cores -- Now have a VERY GOOD picture of what the Old Normal used to be ...
Global Climate Change Indicators
National Oceanic and Atmospheric Administration, NOAA
National Climatic Data Center
Climate Monitoring State of the Climate Report
Global Climate Change Indicators
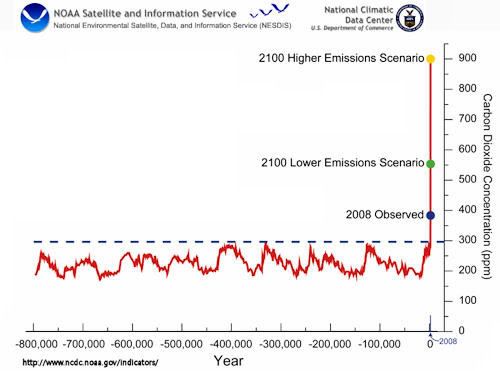
800,000 Year Record of Carbon Dioxide (CO2) Concentrations
Over the last 800,000 years, natural factors have caused the atmospheric carbon dioxide (CO2) concentration to vary within a range of about 170 to 300 parts per million (ppm). The concentration of CO2 in the atmosphere has increased by roughly 35 percent since the start of the industrial revolution. Globally, over the past several decades, about 80 percent of human-induced CO2 emissions came from the burning of fossil fuels, while about 20 percent resulted from deforestation and associated agricultural practices. In the absence of strong control measures, emissions projected for this century would result in the CO2 concentration increasing to a level that is roughly 2 to 3 times the highest level occurring over the glacial-interglacial era that spans the last 800,000 or more years.
larger image
For nearly the last Million years, CO2 levels in the Atmosphere, stayed between a reliable
"range of about 170 to 300 ppm (parts per million)" (the "Old Normal" is the zig-zaggy Red line over much of the Chart's historic view.)
That vertical Red spike at the end, is the human "Industrial Age".
In 2008, we were at that Blue Dot level. (this is the "New Normal", for CO2)
Of course "normal" may end up being a terrible misnomer, before were done.
Humans, in our non-existent collective wisdom, have chosen to ignore that ancient Geologic History --
We have chosen to blaze our own Carbon-Fuelish Trail -- at least until that "last well" gets drilled!
393 ppm and counting ... and tack on 2 ppm per year
[unless something changes, and an Energy Bill is passed -- finally!]
Humans apparently LOVE pushing the boundaries of the possible -- especially when there's a Quick Easy Buck to be made, in the process!
Looks like we got another one of those "Uncontrolled Experiments" going on again, when it comes to leaving those "CO2 Sprinklers" on overtime. We got water to burn apparently.
We live in Epic Times.
(PS. can someone roll down the windows, on this run away truck, please ... I'm starting to get warm.)

