Stochastic Democracy is launching an Forecasting System tomorrow, featuring district level House, Senate, and National level races via a Bayesian Multi-level model that takes into account Pollster Bias (House Effects) and Pollster inaccuracy (PIE).

Congressional Districts, colored by estimated Democratic Vote
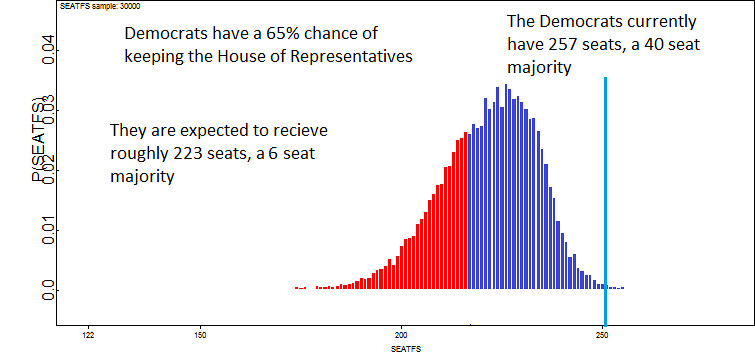
Histogram of the number of Democratic Seats in November
In the meantime, top-level results and preliminary graphs are available below the fold or at StochasticDemocracy.Com for feedback purposes.
***Cross-posted at StochasticDemocracy.com****
Stochastic Democracy is launching an a major Election Forecasting System tomorrow, featuring district level House, Senate, and National level estimates via a Bayesian Multi-level model that takes into account Pollster Bias (House Effects) and Pollster inaccuracy (PIE).
More detailed race-specific breakdowns, explanations of methodology, and polling data will be released tomorrow. In the meantime, feel free to ask questions in the comments section.
Top-Line Results:
Generic Ballot Two-Way Vote* - Democrats - 49.9% Republicans - 50.1%
Probability that Republican lead in Generic Ballot is real - 52%
Senate:
Expected Number of Seats: 55.7
House:
Expected Number of Seats: 222.6
Probability of Democrats keeping the House: 65%
Probability of Democrats keeping House if Election was today: 86%
*Two-way vote is defined as Democratic_Vote/(Republican_Vote+Democratic_Vote), which strips out undecided voters.
Tell me what you like, what you don't like, what isn't intuitive, and suggestions for alternative visualizations. Also, feel free to note if something looks funky:
Histogram of Democratic Seats in the 2010 Midterm election in November
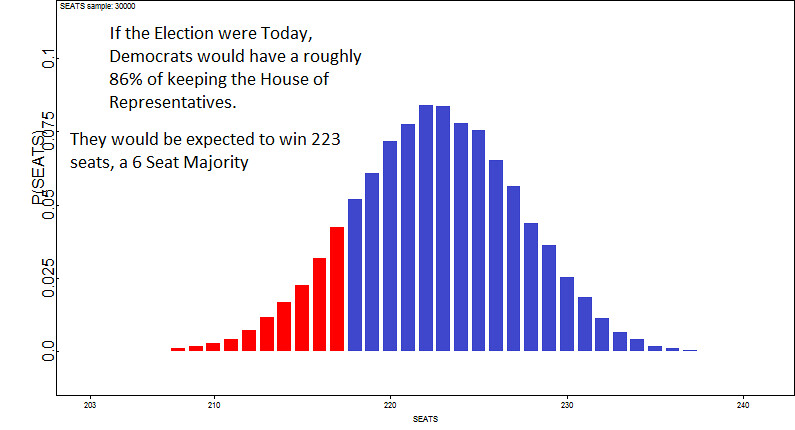
Histogram of Democratic Seats in the 2010 Midterm election if Election was today
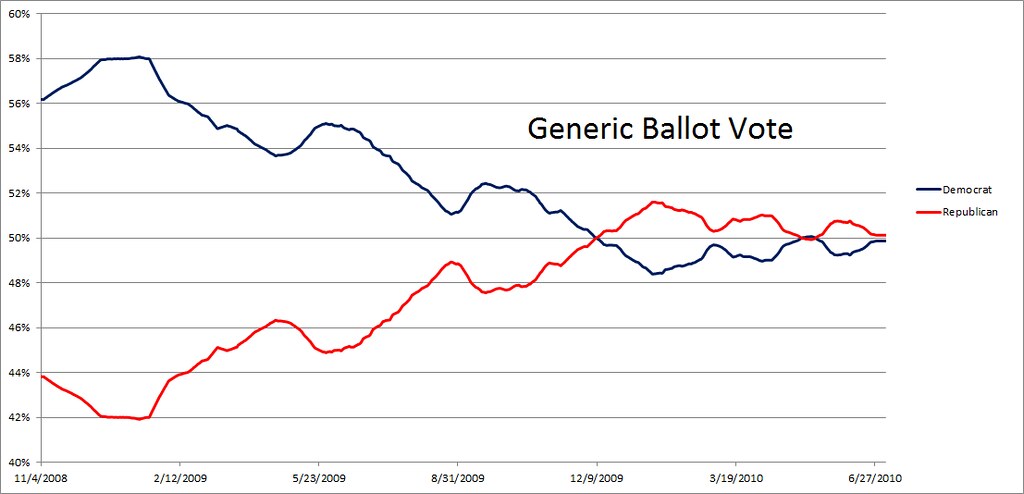
Estimated Two-Way Generic Ballot estimate over time (Question: "Who do you intend to vote for in your district")
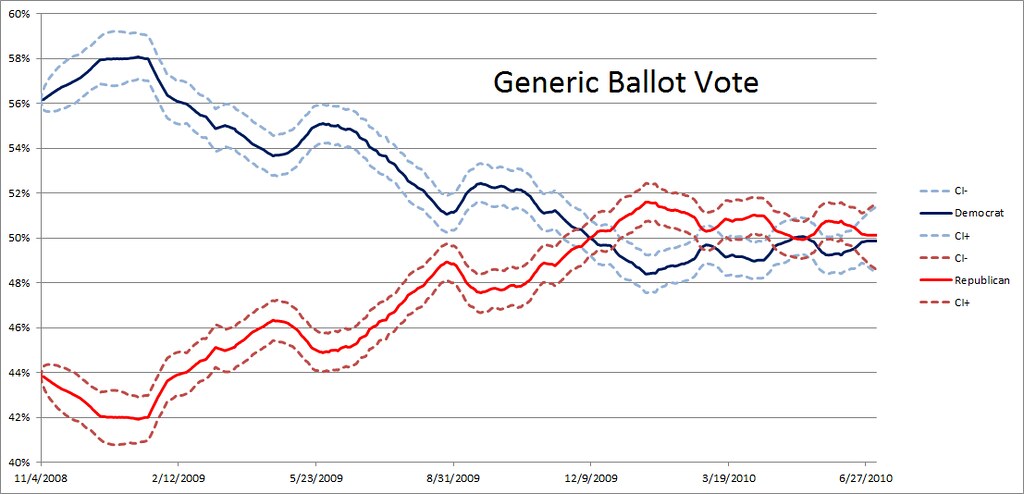
The same as before, but this time with scary 95% confidence intervals
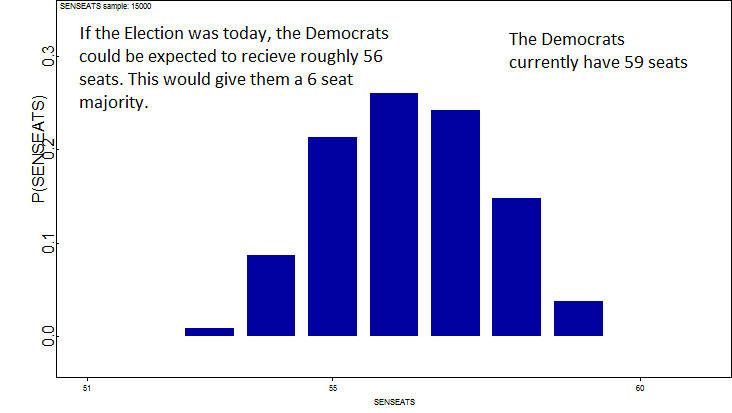
Distribution of Senate Seats if the election was today.
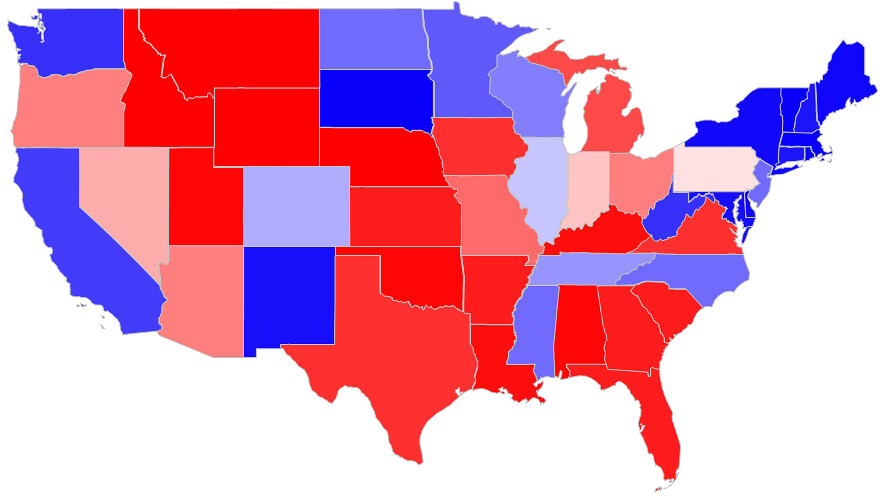
Color indicates expected percent of State delegation that will be Democratic if the Election was today
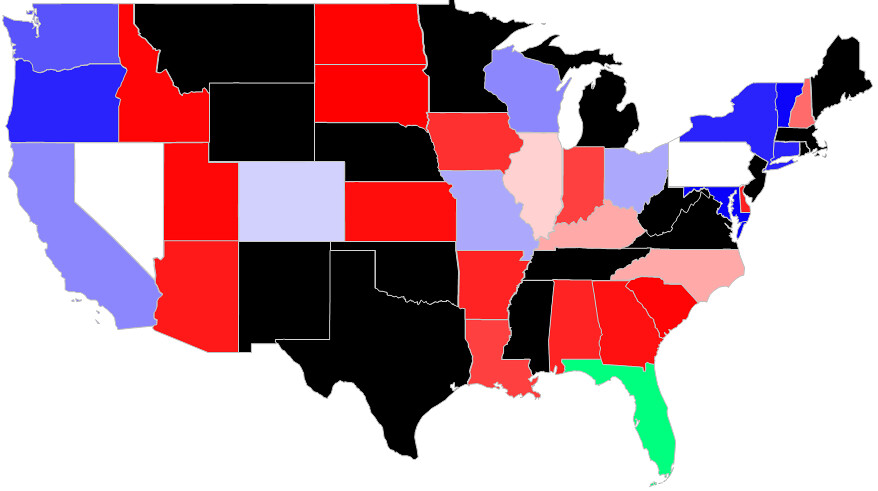
Senate map, colored by Democratic vote-share. Green indicates third-party candidates, Black indicates states without senate races.
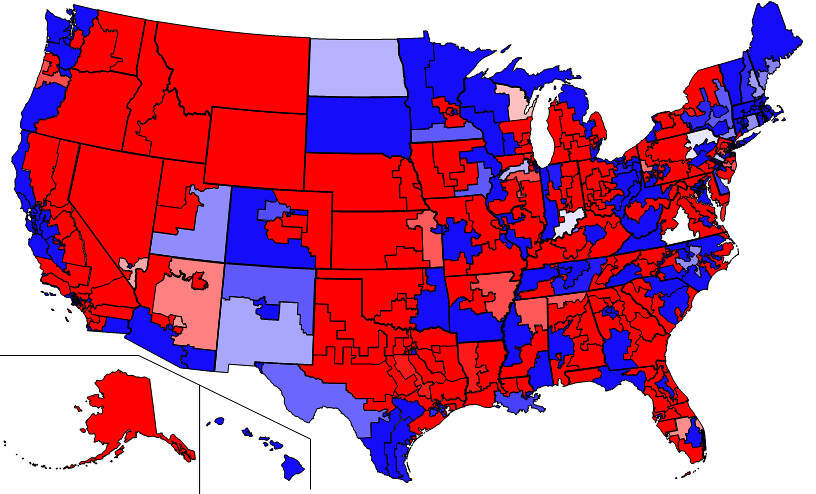
Congressional district level forecast - Colored by Probability of Democratic Victory if Election was today
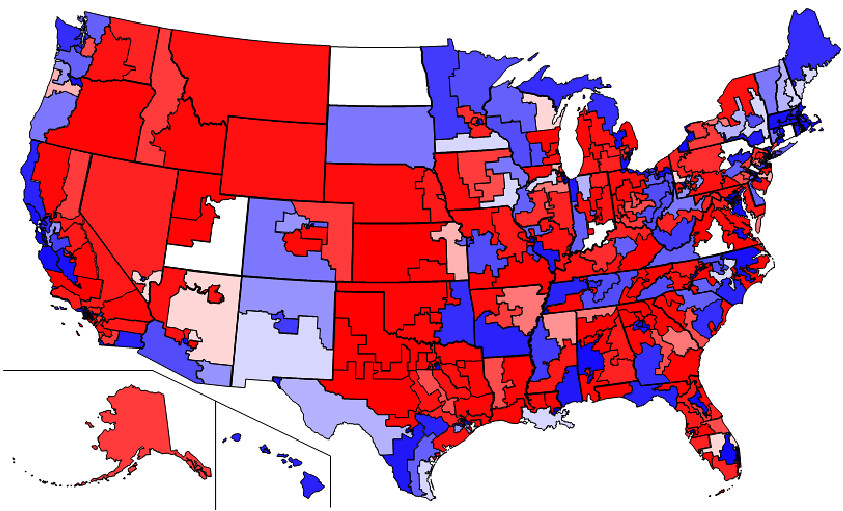
CD map, colored by estimated Democratic Vote-Share (Quadratic Color Scale)
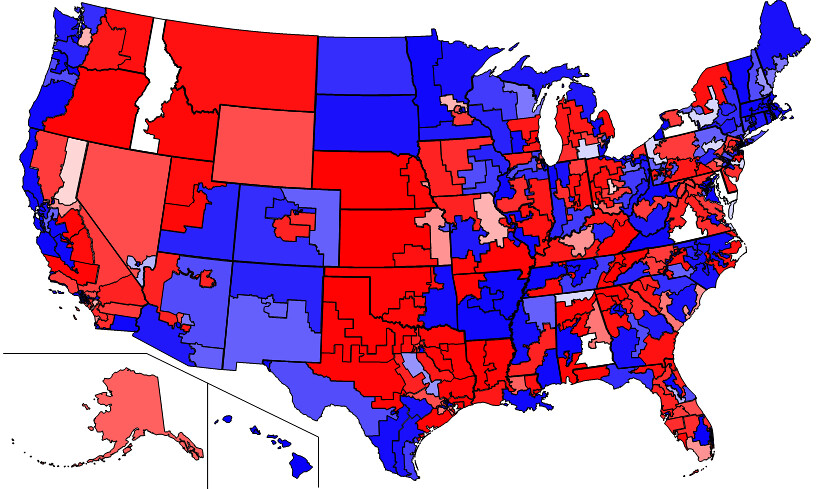
For reference, the 2008 results under the same color scale
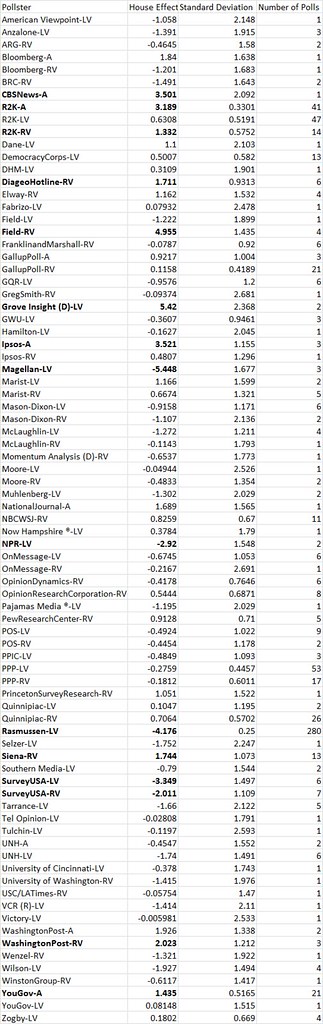
Pollster Bias relative to Pollster Consensus. Lower Numbers indicate Bias toward Democrats. (Click to expand)
***Cross-posted at StochasticDemocracy.com****
