Welcome to another edition of Saturday Morning Home Repair Blogging, where everyone is welcome. Whether you don't know one end of a screwdriver from another or you're a professional remodeler, there's always a group of people here who can answer most any question about projects around the house. I'm boatgeek, your host for this week. After the jump, I'll have some info and pics of the solar installation that just went up on our roof.
Please keep Claude, the founder of SMHRB, in your thoughts as he and his family recover from personal tragedy.
Efficient solar power is one of the holy grails of the alternative energy world. Enough solar energy hits the earth every day to easily power the planet, if only we could harness that power. Unfortunately, solar panels aren't particularly efficient at turning photons into electricity. Most solar panels on the market only convert about 10%-15% of the solar energy into electricity under ideal conditions. Obviously, in the real world, conditions are rarely ideal.
Just about the first question we get about our solar installation is "Solar power? In Seattle? Isn't it too rainy?" Well, yes and no. It's true that between October and March, we won't generate all that much power. The upside is July and August, when there is generally little rain and nearly 16 hours of daylight with the sun high in the sky. On an annual basis, Seattle gets about as much solar radiation as most of the upper Midwest. Sure, the same installation in Honolulu, Miami, or Albuquerque would generate a lot more power, but we can generate a fairly respectable amount here as well. There's more data on average solar energy numbers for various cities in the country here.
When the solar people come out to your house to give you a quote, the first thing they do is check the shading of the site. The solar panels need direct sunlight to work, so any shade comes right off your generating capacity. This is what our sky looks like from the top of the roof as seen through a fisheye lens.
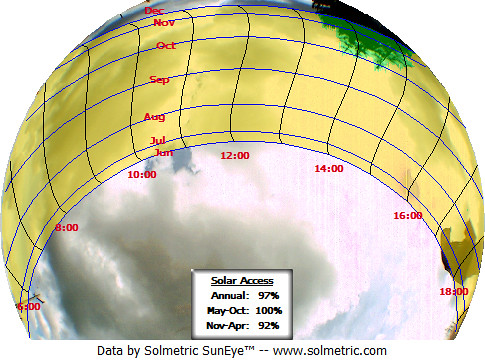
South is up in the picture, and west is to the right. The blue lines on the picture show the path of the sun through the day in different months of the year, and the black lines show where the sun is at different hours of the day. Yellow is clear sky where the sun travels, and you can see a little bit of green where the solar panels are shaded by a tree in the neighbor's yard. This shading is actually pretty good, since the tree only shades us during the winter months, when we don't have all that much sunlight anyway. In the summer months, these panels are completely unshaded.
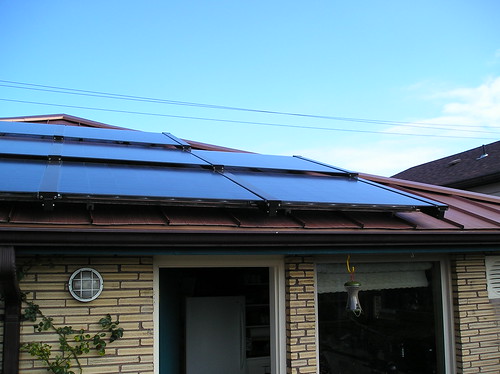
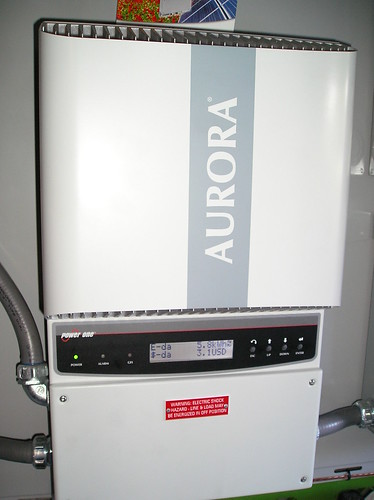
The picture at the top of the diary is most of the western half of our solar array. It has ten panels, while the southern half has nine. Each panel is rated at 195 watts, so our theoretical capacity is about 3700 watts. Since the panels were turned on in late September, the highest output we've gottten is about 3200 watts. All together, we expect these panels to generate about 3900 kilowatt-hours (kWh) per year on average, which is about half our usage. The panels are made by Silicon Energy, about an hour north of us in Washington State. Silicon Energy also supplies the inverter which connects the panels to the grid.
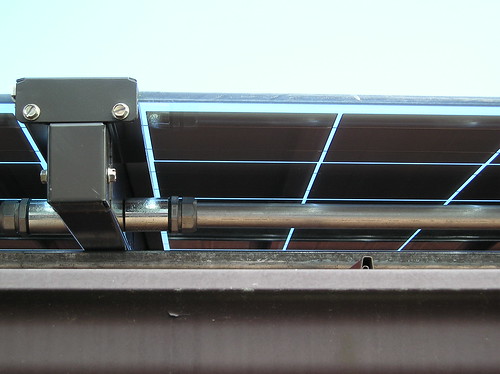
This picture is a closeup of the supports for the solar panels. Each panel has a support going up each side. These supports sit on top of crosspieces that in turn are clipped to the roof's standing seams. Metal conduit joins all the pieces and keeps squirrels away from the wires. Having a standing seam roof gives us slightly better power output because there's an air space below to cool the panels. A cooler panel puts out slightly more power than a hot one. The solar installers added two new roof penetrations to bring the power from each half of the array into our attic. Power goes from the from the attic to the inverter (in the garage) via an old conduit we had in the wall.
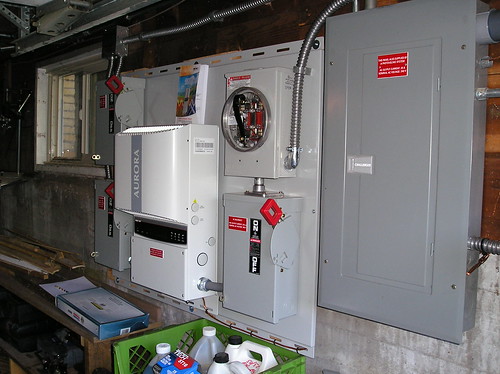
The inverter is the brains of the outfit. It turns the all-kinds-of-voltage DC power produced by the solar panels into clean AC power for the house. Power comes into the inverter through the shutoff switches (one ofr each half of the array) on the left side, is converted in the box in the middle, and goes out to the meters through the switch on the right side. If this were an industrial installation with good fencing, we could mount the inverter outdoors. If we did that, the production meter would be in the circular hole on the right. Since it's inside, we need an external meter so the power company can read the meter.
We're not off the grid with this system, so there's no batteries. We draw power from the grid when we aren't producing enough power to cover our needs, and supply power back to the grid when we make more than we need.
This particular inverter requires AC power on the supply side to operate, as a safety measure for utility crews working on wires during outages. In theory, we could still power our house with a small generator if we had a major outage. However, we're right in the city with a good grid of power lines and about three blocks from a substation, so we've never had a major outage.

Here are our two meters. The one on the right measures our total power production, and only runs forwards. The one on the left measures how much we've drawn from the grid, so it runs forwards and backwards depending on whether we are drawing from or supplying to the grid, respectively. The astute observer will see that we don't have a meter in the production slot yet. That's because we took the pic before the power company had installed the production meter.
And now the money. The natural question is how much does all of this cost and when, if ever, does it pay off? In Washington, we have a couple of advantages and one disadvantage to making solar pay. On the "minus" side, our power is ridiculously cheap, since it largely comes from city or federal dams. Dams don't need fuel, so our rates are low. Depending on the season and consumption, each kilowatt-hour costs either 3 cents and 9 cents. This is great for the consumer, but it makes it harder to make renewables pay.
On to the plus side. First of all, the state pays consumers to generate power from renewable sources. If the equipment is made in Washington, the subsidy is higher. Because our panels and inverter are made here, this subsidy ends up at $0.54 per kWh, 6 times what we would pay the utility for that power. Also, all of the utilities in the state are required to generate a certain percentage of their power from renewable sources in the near future. The utilities behind the renewables curve have found it cheaper to give incentives to homeowners to generate power than to solely develop new sources of renewable power. Unfortunately for our pocketbooks, Seattle City Light has already bought into several commercial wind farms, so we don't benefit from this directly. In the pic above, we've earned $3.10 on power at that point in the day on our production of 5.8 kWh.
On the tax side, Washington waives sales tax (9%) on renewable energy installations, and we'll get a federal tax credit for 30% of the cost of the array.
Here's the breakdown on the dollars:
Cost: $31,400
Federal Tax credit: -$9,420
Net cost after credits: $21,980
Net metering savings 2011-2020: $3,510
State production incentives 2011-2020: $21,027
Net profit after 10 years: $2,557
You can see that we're not getting rich off of this. The payoff period isn't an accountant's dream. But all told, we should be in the black in 8-10 years. The production incentives are only guaranteed by the state until 2020. If they continue, we'll make about $2500/year on power after that between the incentives and power savings.
OK, enough about solar. The floor's open--let's hear what you have going on this weekend.
