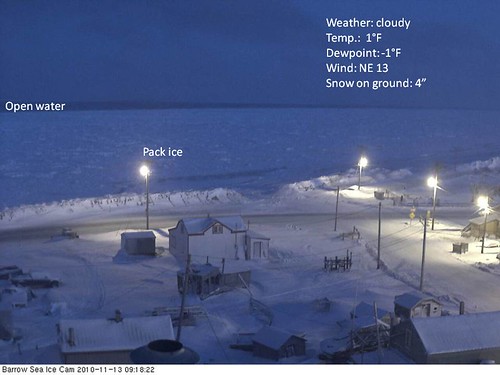
What's been going on in the Arctic? First I'll show a picture from Barrow AK's Arctic sea ice webcam as I often do. This one is from 9:18 a.m. Alaska time on 13 November 2010. Snow on the ground of 3", and the near-shore sea ice is affixed to land, while you can see there is open water well-offshore.
More below.
News from the Arctic: 12 October - 11 November 2010
Those 1°F temperatures in Barrow AK might sound cold to you. But the normal high on 13 November is 5°F, with a normal low of -5°F, so it's just about exactly on target. October ran 7.9°F above normal, and so far November is running 6.6°F above normal. They have run above normal the last 5 Octobers, because the water in the Arctic is staying open longer than in the past, and that is because of both warmer air temperatures and increased absorption of incoming solar radiation resulting from sea ice melt.
Now for the climate for the the last 30 days in the Arctic. First the temperatures (taken at about 3,000' above ground level, to avoid problems with the 2-m temperature analysis):
October 12-November 11, 2010 925 mb (3000') Temperature Anomalies (°C)
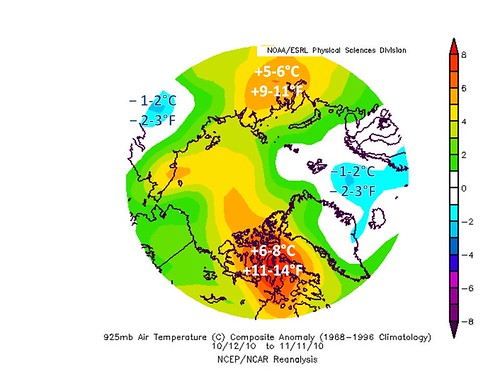
It was warmer than normal in the Arctic basin for the 31 days ending 11 November 2010 almost everywhere. Likely this is the result of open water and/or thin ice, through which more heating from the ocean below can radiate to the air above. It's also the result of warm air from the south coming into the Arctic from Asia and the North Atlantic (via the Davis Strait west of Greenland), as I'll show later.
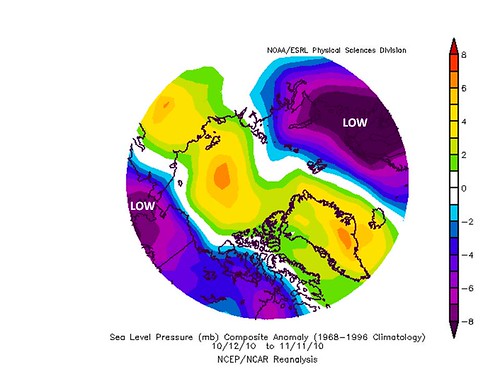
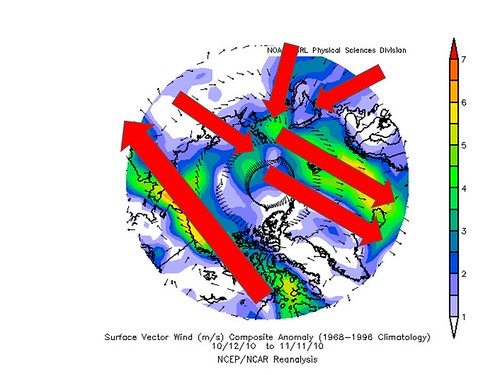
Sea level pressure and surface (10-m height) wind anomalies for the last 31 days are shown below. Pressure was anomalously high in the Arctic Ocean basin, eastern Siberia and Greenland and anomalously low over Europe, western Asia, North America, and the northern Pacific. Anomalously strong winds circulated clockwise around this high pressure. Winds were blowing out of the Arctic toward Europe (the only area with below normal temperatures), from the north Atlantic into the Arctic via the Davis Strait and the Canadian Archipelago, and from Asia into the Siberian Arctic.
October 12-November 11, 2010 Sea Level Pressure Anomalies (millibars)
October 12-November 11, 2010 10-m Wind Anomalies (meters per second)
Condition of the Arctic Sea Ice on 12-13 November 2010
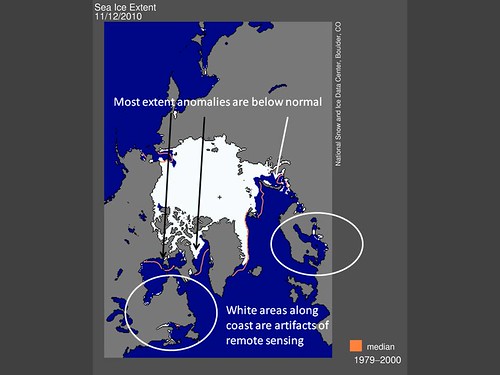
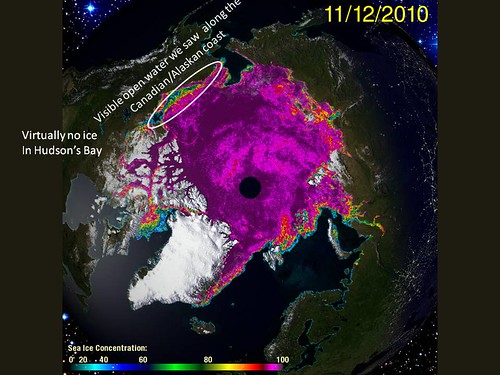
The Arctic sea ice extent map from the National Snow and Ice Data Center (NSIDC) for 12 November 2010 is shown below. Much of the Arctic ice edge is poleward from the 1979-2000 normal. The graphic below that shows the sea ice concentrations from 13 November 2010. In that graphic, we can see where the open water in the Barrow AK webcam is coming from, with low sea ice concentrations near the Alaskan coast, as well as north of western Canada.
National Snow and Ice Data Center Arctic sea ice extent, 12 November 2010
Univ of IL Urbana-Champagne Arctic sea ice concentration, 13 Nov 2010
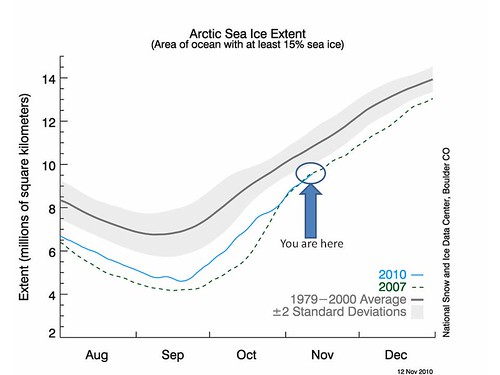
How does the current sea ice extent compare to earlier years? We have the NSIDC time series of Arctic sea ice extent from 1 August through 31 December for the 1979-2000 mean (with ±2 standard deviations around the mean, where 95% of the time the sea ice extent should be if the climate is at a steady state), and for 2007. For the current year 2010, the sea ice extent time series is shown through 13 November. While the sea ice extent this year was running consistently ahead of 2007 through early October, it has since been running about the same as that year. 2007, if you recall, was the year of the lowest Arctic sea ice extent in the satellite record (and likely longer).
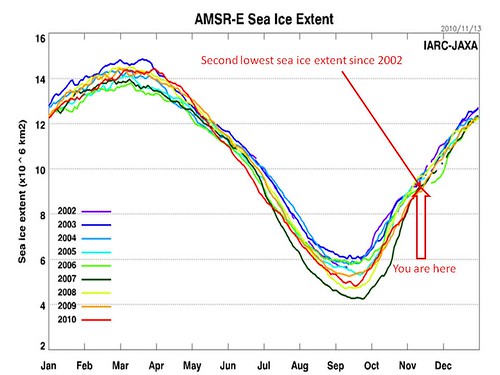
Below the NSIDC time series is another from the International Arctic Research Center (U of AK-Fairbanks)/Japan Aeronautical Exploration Agency (IARC/JAXA) microwave sensor (AMSU-A). 2002-2009 are included for the full calendar year, while 2010 is included from 1 January through 13 November. We see that this year has the second lowest sea ice extent in the 2002-2010 record.
NSIDC Arctic sea ice extent time series from 1 August to 31 December
IARC-JAXA time series of Arctic sea ice extent, calendar years 2002-09 and 1 Jan to 13 Nov 2010
Volume of Arctic Sea Ice Now and Since 1979
As I've said in previous diaries on the Arctic, it's not just sea ice extent that matters, but sea ice volume as well. The University of Washington Polar Science Center maintains a state-of-the-art Arctic sea ice volume model that has been validated using actual measurements of sea ice thickness with the sea ice extent (area times thickness equals volume, so you need both). The model has been updated through 7 November of this year, from its beginnings at the start of the satellite record. At the beginning, sea ice thickness was obtained from nuclear subs moving under the Arctic ice; after 2002 we have satellite measurements (ICESat) that can be taken to determine the thickness.
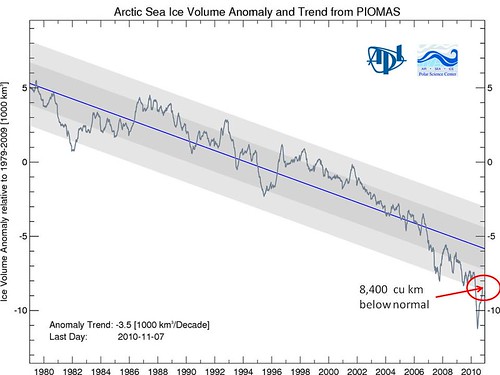
The graphics below show from top to bottom, the modeled Arctic sea ice volume anomaly and the seasonal cycle of daily mean sea ice volume from the same model, averaged from 1979-2009.
PIOMAS Arctic Sea Ice Volume, 1979 through 7 November 2010
Daily Mean Arctic Sea Ice Volume, Seasonal Cycle
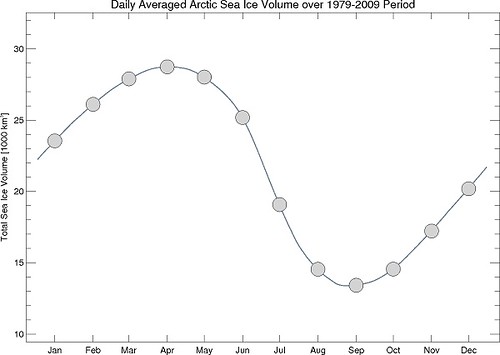
Looking at the daily mean graphic, it appears that 7 November over the 1979-2009 period had a mean sea ice volume of about 18,000 km3, so our 8,400 km3 anomaly from the upper graphic means that we're now at about 9,600 km3. In September 2010, the sea ice volume had dropped as low as about 4,000 km3, or about 30% of the September normal.
What is most interesting (and most frightening) about the sea ice volume anomaly is the increasing rate of decline from the linear trend in recent years. You would think that if we are approaching a limit for volume, the rate of decrease would slow down, rather than speed up. It clearly hasn't been slowing down.
Take from that what you will.
Oh, and a final item: the global remotely sensed temperature from the University of Alabama, Huntsville, home of a global warming skeptic who monitors these temperatures. I guess he isn't happy today either, and nor should we be.
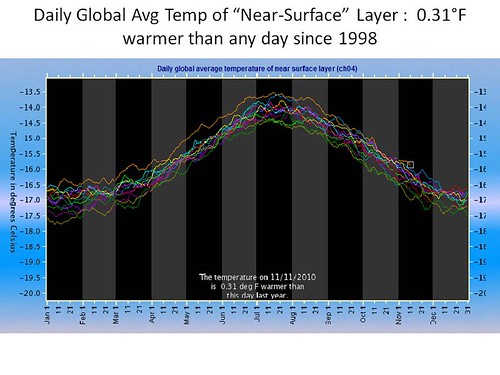
The last day of measurement available when I screen captured this image, 11 November 2010, was 0.31°F warmer than any previous 11 November since 1998.
Now for the Climate News Links.
========================================================================
========================================================================
BP & FOSSIL FOOLISH NEWS
New Orleans Times-Picayune Stories on BP Oil Spill.
This link is invaluable for looking at BP oil spill stories. Included in the headlines lately:
- Little Risk of Cancer from BP Oil Burn Dioxin.
The scientists measured the release of two families of toxic chemicals -- polychlorinated dibenzodioxins and polychlorinated dibenzofurans -- by collecting samples with a battery-operated instrument package suspended in the plumes of 27 surface oil fires between July 13 and July 16.
But the results represent an averaged sample from a number of smoke plumes during a 4-day period, thus missing potential extremes.
- Scientists Wary of BP Oil Spill's Long Term Effect on Species.
But then we have this story about vigilance. It's clear we won't know the full impact of this ecological disaster for a long time.
- Late-night editing slipped error into deep water drilling moratorium report.
Not sure I heard anything about this story in the media. Given the poisonous environment against the President, I'm a little surprised. But then again, maybe this isn't a big deal, since the Obama Administration pointed it out almost immediately, and clarified the report.
- First New Drilling Permits Issued Since Moratorium Was Lifted.
The Interior Department's Bureau of Ocean Energy Management, Regulation and Enforcement approved a permit Wednesday for Australia-based BHP Billiton Petroleum Inc. to drill a new well in the Shenzi oil field, about 100 miles south of Grand Isle. The project is for shooting water into the rock formation, a process that helps bring oil to the surface and that was allowed under the moratorium.
Also, BOEMRE approved a permit last month for Stone Energy to drill a sidetrack well, in which an existing well head is used to drill diagonally to a new target. The work is planned for a fixed platform less than 20 miles off the mouth of the Mississippi River. The Stone Energy permit is for work from a fixed platform with a blowout preventer at the surface, operations that were allowed to continue under the moratorium.
Important note is that both would have been permitted under the moratorium anyway.
- Stop UK Government's Grand Forest Sell-off, Urge Protection and Restoration for the People's Old Forests
Apparently the Tories wanna get some money to balance the budget, on the back of old growth forests. Are you surprised? I'm not.
From the U.K. Government site managing the transition:
We are committed to shifting the balance of power from ‘Big Government’ to ‘Big Society’ by giving individuals, businesses, civil society organisations and local authorities a much bigger role in protecting and enhancing the natural environment and a much bigger say about our priorities for it.
They're full of it, especially since they say they will regulate how the forests are managed after the sale. That's worked out so well in the U.S. for land that should be in the "commons", owned by us all. Ask any OIL company.
- Coal of Africa shares jump after environment deal.
Coal of Africa Corporation dodged a bullet in South Africa when it reached an agreement with the South African government that allowed it to keep open its Mooiplaats mine. But this appears to only be because the government had not fully written and implemented the new regulations that could have resulted in the mine's closure. Stay tuned.
CLIMATE CHANGE & ENERGY
- Questioning the ‘Smart’ in Smart Meters.
Apparently some folks are worried about the radiation emitted by smart meters, others about their accuracy. I'm happy with mine, at least so far. Some others, not so much. Lots of links below the blog entry.
- Climate Change Finds Its Way Into Energy Contracts.
From a law journal no less, albeit the Law Technology Journal, an article stating that there is a trend in legal contracts to deal with the "risks" presented by potential new realities in carbon regulation. We can only hope that they're being prescient, and don't plan on merely finding ways to flout any laws that may be coming.
- Largest solar power plant in Mass. about to start.
Well, MA isn't the sunniest place in the U.S., but they're working toward more solar. Kind of like Germany's solar subsidy they did over the last 10-20 years ... not the best climate for it, but every bit helps.
CLIMATE CHANGE POLICY/POLITICS
- The Debt Commission ignores the carbon budget.
Given the Debt Commission's composition, it's not surprising that they would ignore the economics of our carbon energy policy. But their guiding principle states the following:
"We have a patriotic duty to come together on a plan that will make America better off tomorrow than it is today."
Apparently, it's only the REAL Americans they refer to (read: rich white ones) ... or at least they think that not dealing with climate change will have no impact on such people. I have news for them, and so does Joe Romm in this Climate Progress blog entry.
- Environmentalists 'exaggerated' threat to tropical rain forests from global warming.
Going back to the Paleocene-Eocene Thermal Maximum (PETM), scientists found that tropical forests flourished and species diversity increased among plants in particular. New species like those that produce chocolate (see more later) appeared.
However, one piece is missing; there was no human-instigated deforestation 56.3 million years ago. It's that aspect of anthropogenic change, missing at the time of the PETM, that results in the permanent destruction of our rain forests because of vegetation-climate feedbacks. For example, 50% or more of the rainfall in the Amazon is the result of recycling local soil moisture through plant evapotranspiration. Plants evapotranspire during the day as they make food for themselves through photosynthesis.
I suppose this is why "exaggerated" is in quotes in the headline?
WATER, AGRICULTURE & NATURAL RESOURCES
- Climate change threatens wheat crop, farmers fear.
This San Francisco Chronicle piece reads like a dirge for wheat. From Africa to the U.S. and Canada, one of our staple crops is threatened. Lack of water, mutated wheat stem rust fungus and mutations in other agricultural pests, sensitivity to temperature, and other issues will impact the amount of wheat we can grow. And the population dependent on wheat is not getting smaller.
- Climate Change Poses Threat to Middle East
How ironic that one of the biggest sources for carbon energy will be very adversely affected by global warming. The main threat is lack of water as the climate warms. Reasons: decreased precipitation from jet stream bourne storms and increased evaporation and water demand.
WILDLIFE & ENDANGERED SPECIES
- Global Warming Could Lead to Vast Chocolate Shortage.
Say it ain't so! And after you told me the only reason the tree from which we get chocolate evolved was because of global warming back in the day?
Seriously, it's a two-prong problem ... it's not profitable for those who grow it where it grows well, and in places that can take up the slack, climate change is drastically reducing the crop.
- Owls' clue to climate change
Apparently, owls regurgitate what they eat in small pellets, from which the small bones of their prey can be recovered. So we can find out what it was they ate. In a cave in Utah, there's a 13,000 year record of what the owls ate which seems to go along with what we know about changes in climate there. This information can be extrapolated to see what small animals are likely to remain in the area, while the climate warms over the next several decades.
That's all folks, for now.
