On August 24 of last year, I wrote a GBCW diary, largely because of the uncivil tone expressed in my diaries regarding my economic analysis. Starting on May 8, 2009 my outlook on the economy -- as dictated by an analysis of the underlying facts -- began to turn more bullish. However, since my departure a fundamental question remains: was this bullishness warranted? As I will demonstrate below, my analysis was accurate.
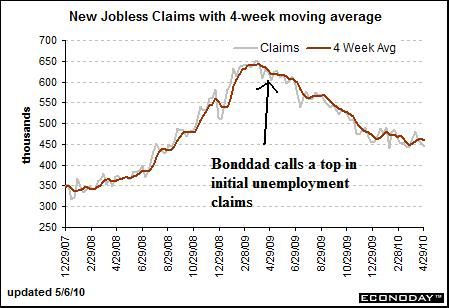
Let's begin with the April 9 diary, titled Has the Employment Situation Bottomed? In that diary, I cited a Barron's article that argued initial unemployment claims had topped out. After looking at the chart, I agreed with the conclusion:
That's a good looking chart of initial unemployment claims. The bottom line is we have enough data to make a call that the 4-week moving average appears to be topping out. That's a very good sign.
That was a correct call, as indicated by this chart of initial unemployment claims:
However, I also noted the following:
So -- the rate of job destruction appears to be topping. HOWEVER, we're not out of the woods yet as the rate of job creation has yet to pick up.
This was also a correct call, as the unemployment rate would continue to rise until it hit 10% later that year.
On May 16 of last year, I wrote a diary titled Are Retail Sales Bottoming? In this diary, I concluded:
Let me make clear: I don't think we're going to have a gangbusters, consumer led recovery. The US consumer still faces a weak job market, massive debt and a big destruction in his wealth over the last few years. This is not an environment where people will go out and spend. However, I do think that the overall trend of durable, non-durable and retail sales numbers indicates the decline is moderating and we will see a clear bottom over the next 4-6 month
I based that conclusion on data from the Census Bureau and Bureau of Economic Analysis. Here is a chart of real retail sales since January 1, 2009:
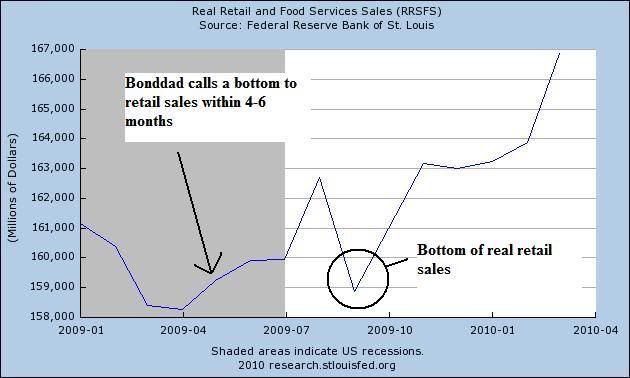
The bottom to real retail sales fell within 4-6 months from my prediction.
On June 5, 2009, I wrote a diary titled Is the Treasury Market Signaling Recovery? The Treasury market is usually a good leading indicator of economic activity as noted by such market analyst as John Murphy and Martin Pring. The reason is simple: as the economy starts to bottom, traders sell safer assets like Treasury bonds and move into riskier assets like corporate and junk bonds and stocks. As the long end of the Treasury curve sells off, interest rates increase. Conversely, the Federal Reserve is usually cutting rates at the same time. The combined action leads to a steepening yield curve.
Notice in both the early 1990s and the early 2000s the Federal Reserve was cutting rates well into the expansion as a way to power the economy forward. In other words, the yield curve widened because the Fed was still in a very stimulative posture. The same is true of the current Fed -- they have lowered interest rates to essentially 0% after adjusting for inflation.
So -- let's sum up so far:
1.) The longer part of the Treasury curve is selling off. BUT
2.) Other riskier assets like higher-grade corporate bonds, junk bonds and equities are rising indicating we are also seeing a reallocation of assets into riskier assets. In addition,
3.) The yield is steepening because the longer part of the curve is selling off while the shorter part of the curve is still stimulative. This is exactly what happened in the early parts of the previous two expansions.
The signals sent by the bond market were correct.
On June 27 I wrote a diary titled The Recovery Is On the Horizon, which also included commentary from New Deal Democrat. This diary used the Leading Economic Indicators from the Conference Board, the ISM Manufacturing Index, the Philadelphia Fed Manufacturing Index, the New York Empire Index and Credit Spreads as a basis for arguing the recovery was indeed on the horizon. Below are the charts in order presented of the previously mentioned indicators.
The LEIs have continued to show expansion, as have
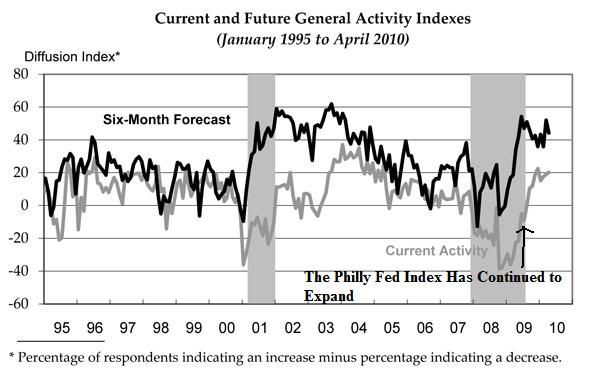
The Philly Fed and
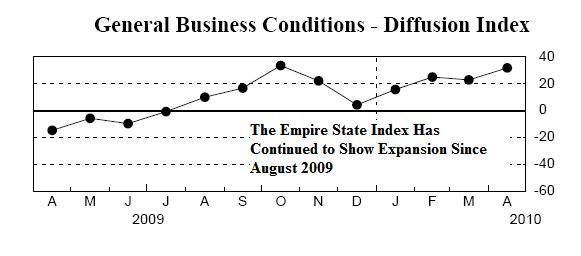
Empire State. In addition,
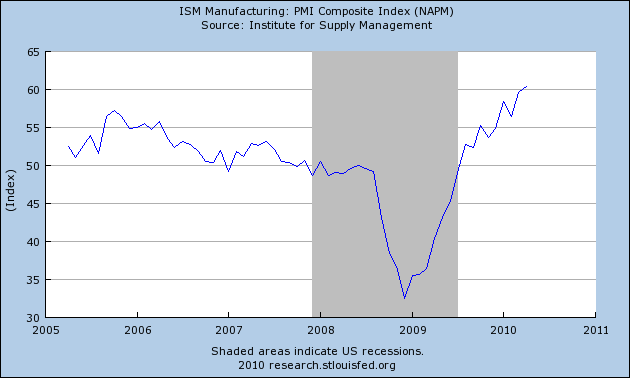
The ISM Index has taken off.
In that diary I made the following conclusions:
1.) I am NOT saying "isn't it wonderful that people are unemployed at high rates". I am also NOT SAYING "we shouldn't care about people who are unemployed." I am saying that the signs are there in more then a cursory fashion that the economy is bottoming and we will start to see positive GDP growth soon.
2.) Positive GDP growth is a prerequisite to employment growth. For those of you who disagree, please show me a time when a country had negative GDP growth and positive employment growth.
3.) Recovery comes in stages. There is no way we are going to wake up tomorrow and say "gee, isn't it wonderful having 4% GDP growth!" It is going to take considerable time for the economy to heal. A good analogy is it is impossible to turn around a battleship on a moments notice.
4.) However, the cumulative total of all the indicators says the economy is clearly bottoming. Combine that with a massive fiscal and monetary stimulus and the possibility of positive GDP growth is incredibly high.
5.) I have repeatedly stated I do not think the recovery will be robust. In fact, I think we'll be stuck in a 1%-2% growth rate with high unemployment for at least another year and a half or longer.
Pay particular attention to point number 4 -- positive GDP growth was a high probability given all of the factors outlines. Also note that in number 5 I underestimated the strength of upcoming growth.
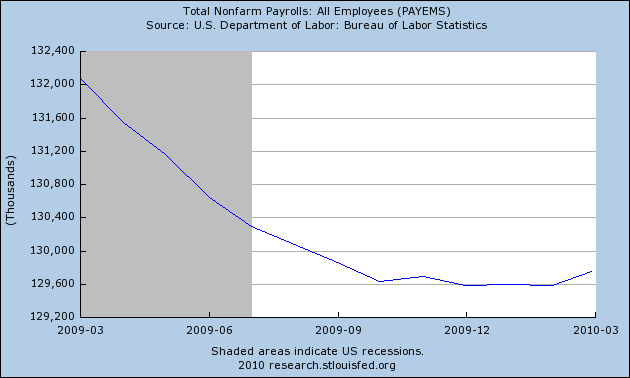
On July 8 I wrote The Economic Free fall is Over. In this I noted the rate of establishment job losses was decelerating. This fact, in conjunction with the dropping 4-week moving average of initial jobless claims, a drop in mass lay-offs and a drop in the Challenger Job Cut Survey and
"you get an improving jobs situation.
As this chart shows, the employment situation was improving as the rate of deterioration continued to decline
The article also focused on the Philly, Empire State, ISM Manufacturing and real retail sales numbers which were covered above. The article also relied on over data such as personal consumption expenditures which had "bottomed out." Here is a chart of PCEs for the last 5 years:
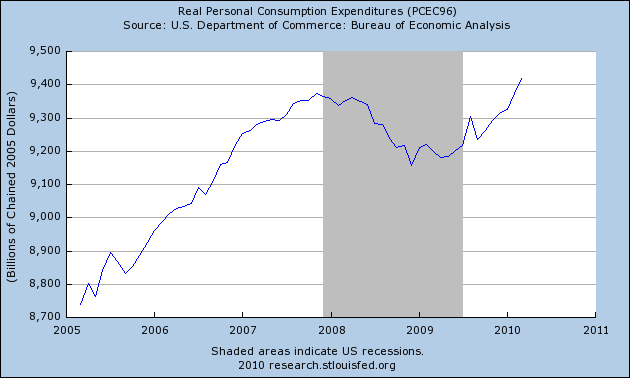
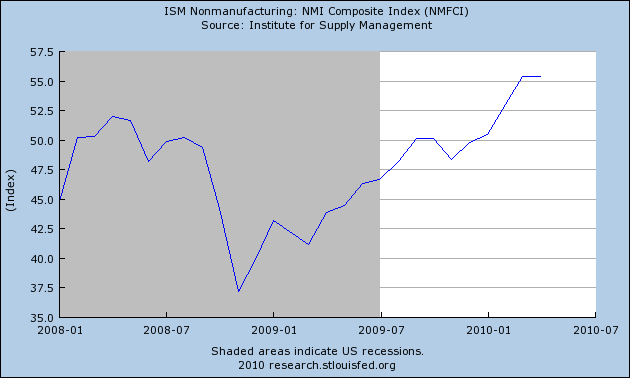
Notice PCEs had in fact formed a bottom and have been increasing since as has the PMIs non-manufacturing index also cited in the diary:
I wrote additional diaries over the next few months arguing the same point -- that the economy had bottomed and growth would soon return. And return it did in the third quarter with a growth rate of 2.2%. Since then quarter over quarter growth has continued.
Let me address the obvious arguments.
1.) Unemployment is still high.
First, this is a true statement. However, as I first pointed out in An Economic Chicken and Egg Story, GDP growth has to bottom before employment growth returns. As I noted:
However, let's look at a simple economic fact. GDP has to turn positive in order for unemployment to start dropping. Below are three graphs from the St. Louis Federal Reserve. They show two data points: the yeare over year percentage change in GDP and the unemployment rate. With all recoveries save one (the one after the end of WWII) GDP has bottomed before unemployment started to drop. Notice that in the 1950s the length of time was fairly long. This difference contracted in the 1970s but returned in the 1980s and beyond. However, regardless of the length of time, it's important to note we need positive GDP growth before we start to think about a lowering unemployment.
We're just at the beginning of a period when we should be seeing job growth -- which we saw last month. Will we see it this month? I have no idea. Wait for tomorrow.
I furthered that analysis in a diary titled When Will Jobs Return?
Now -- that leads to the final question: when will the jobs come back? In order for that to happen we need to see at least one quarter of a positive GDP and probably two. That means the soonest we can expect a drop in the unemployment rate would be the a few months from now and that is only under the rosiest of scenarios. The most likely possibility is it won't be until the end of the first quarter of next year before we start to see a ticking down (and that assumes a stronger rate of growth than I think is going to happen).
While the unemployment rate peaked at 10%, it has since dropped to 9.7% where it has remained for several months. The reason is the structure unemployment. As I noted in this article on my blog, two inter-related events are in play. First, people with lower educational achievement are experiencing very high rates of unemployment. In addition, two areas of the job market are responsible for more than 4.5 million job losses during this recession: manufacturing and construction -- two areas that are typically staffed by employees with lower educational achievement. That means going forward we have two choices: increase job opportunities for those with less than a college education, increase educational achievement or a combination of both.
Let me add a few points.
1.) Why am I writing this now? To defend my record. As I have demonstrated above, my analysis was largely correct.
2.) Am I returning full time? Extremely doubtful. I have come to dislike both parties with extreme prejudice for different reasons.
3.) Did I really leave because of incivility? Yes. I don't write economic analysis for money -- I write for pleasure. And there are only so many insults before you say, "to hell with this; it's not worth it." Regardless of popularity, there are limits to dealing with insults. I reached mine.
4.) Your opinion changed with the new administration. No. The facts changed after the administration had been in office a few months. That's coincidence over which I have no control.
5.) You went to the Huffington Post where people are just as rude. I no longer write there. I have a weekly column at 538.com.
6.) You stopped writing about debt. Actually, I changed my opinion about debt. See this article for a complete explanation.
