This is the next in a series of diaries on the state of Arctic sea ice (and other topics as warranted) in memory of Johnny Rook, who passed away in early 2009. He was the author of the Climaticide Chronicles.
I'm expanding this diary series a bit to include more than just Arctic topics, though that will continue to be my major emphasis. In that vein, here are the headlines for the week ending 14 August:
- Arctic sea ice continued to retreat at an average pace.
- Weather in European Russia continued to be very hot, but the smoke from burning peat and forest fires was cleared by a shift in the wind.
- Yet more flooding occurred in Pakistan, with at least
13 14 20 million people displaced. This is the worst flooding in the history of that country.
- The National Climate Data Center in Asheville NC issued its July 2010 global climate summary. Short description: HOT, but not quite a record if you count land and ocean.
- Hurricane season in the Northern Hemisphere, surprisingly, has had its slowest start on record.
Discussion below the fold.
News From the Arctic
Let's start with a picture from North Pole Webcam #2 from NOAA.
View from NOAA Webcam #2 at 12:29 UTC 14 August 2010
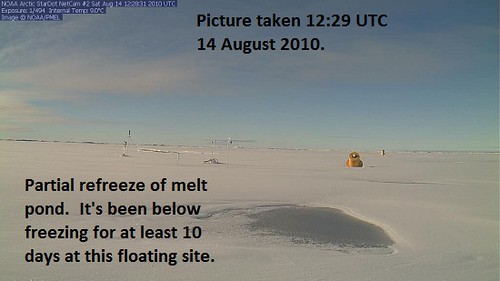
This year, the webcam has not drifted far from the North Pole and was at 88°N or so at the last report. Clearly temperatures have been below freezing (the concurrent temperature record shows it's been ranging between about 26°F and 33°F for the last week or so) and there's been a bit of snow. This is much different from the record low sea ice year of 2007, when the floating buoys wound up moving through the Fram Strait east of Greenland and well down the coast.
The Barrow, AK webcam has been out for several days. I can tell you, however, that it's been a bit rainy and cool (40s to near 50 daytime, 30s to low 40s at "night"). This is actually a bit above normal for them. The month so far there has been 4°F above normal; it was as warm as 67°F on the 4th.
Arctic Climate Since Last Report
The next three graphics show the anomalies for temperature at 925-hPa (about 2500-3000 feet above sea level), sea level pressure, and 10-meter winds as analyzed in the ongoing climate analysis by the National Centers for Environmental Prediction (NCEP) jointly with National Center for Atmospheric Research (NCAR). This venture is known as the NCEP/NCAR reanalysis.
Climate anomalies for 6-12 August 2010 for 925-hPa temperature, mean sea level pressure, and 10-m winds from top to bottom, respectively

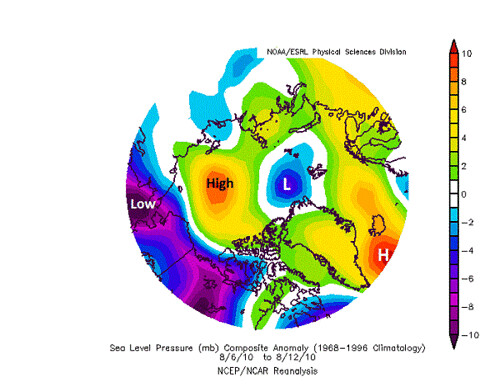
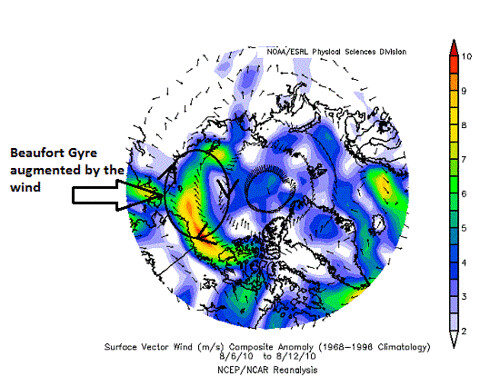
Temperatures over the Arctic basin were near normal (within 2°C or 3.5°F). It was a bit cool in parts of Siberia, mild over the Canadian Archipelago, and HOT over eastern Europe (12°C/22°F above normal). Sea level pressure anomalies included highs over the Beaufort Sea and southwest of Iceland, and a weaker high pressure area over eastern Europe. Anomalously low pressure was north of Greenland and over the Bering Sea to western Canada. The winds reflect this pressure pattern with clockwise flow reinforcing the Beaufort Gyre north of AK and easternmost Siberia.
Arctic Sea Ice
The Arctic sea ice concentration for 13 August 2010 is shown in the next graphic, along with annotated changes from the prior week.
Arctic Sea Ice Concentrations (percent), 13 August 2010
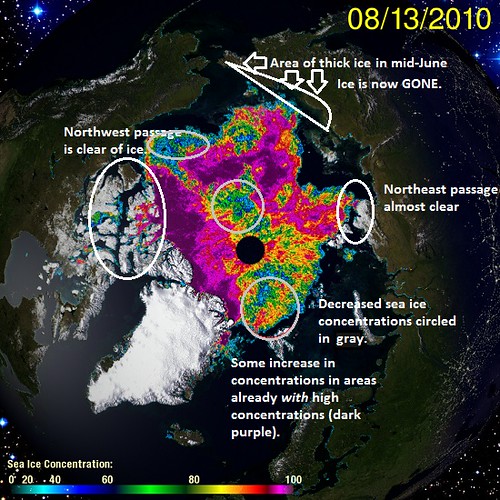
We can see that the ice concentrations have decreased in a number of areas; these are circled in gray. The Northwest Passage through the Canadian Archipelago is now clear from end to end; the Northeast Passage has one bit of ice left at the Arctic coast of central Siberia. Sea ice concentrations have increased a bit where they were already over 90%; these areas are shaded dark purple.
Let's compare this with the sea ice thickness graphic I linked to earlier this summer, when the sea ice thickness controversy was ginned up by Anthony Watts, showing an old Navy sea ice thickness model forecast from June 2010, with thick ice on the northeast Siberian coast. Fascinating ... all that ice has either melted or been moved into the Arctic basin by the prevailing winds.
The time series of Arctic sea ice extent is shown below, courtesy of the [http:nsidc.org National Snow and Ice Data Center].
Arctic Sea Ice Extent, 1 May through 30 September for
2007, the 1979-2000 mean, and for 2010 (only through 13 August)
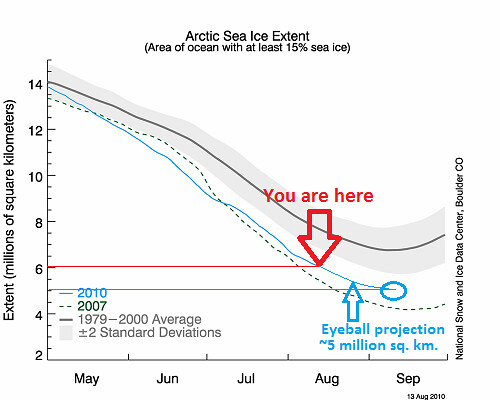
The current areal coverage is a shade over 6,000,000 km2. I've extrapolated to a projected minimum using the long term mean sea ice loss and come up with just a shade over 5,000,000 km2 at the minimum in mid-September. If this projection verifies, that would put this melt year 3rd between 2008 and 2009, and behind 2007. Rank would be 2007/2008/2010/2009. Much of the contribution to the sea ice loss this year was in June, when the so-called Arctic dipole appeared as it did in 2007 for most of the summer. If the dipole had remained through July to the present, we'd be talking, most likely, about potential record minimum sea ice extent for this year.
Future short-term climate trends will determine where the 2010 melt season ultimately ranks. We can say that the long-term decreasing trend that we've seen over the last few decades has not stopped in 2010. This is especially interesting in light of the very late start to the melt year. The prior maximum sea ice extent occurred on 29 March 2010, the latest in the satellite record.
Of Note Elsewhere Around the World and July 2010 Global Summary
The heat wave in Russia continued, though not with triple digit heat. It's been above 30°C (the definition of "hot" in European Russia, equals 86°F) for 30-35 days as of 13 August. With the current mean high temperature in Moscow, RU at 68°F and Moscow temperatures running between 90-95°F, this means for the past week they've been about 22°F or so above normal. We saw the warm spot in those 925-hPa temperature anomalies in the previous section of 12°C in eastern Europe, consistent with the heat wave. The smoke in Moscow that was endangering health along with the heat has moved away from the area with shifting winds. The 90-day time series of temperature and precipitation for Moscow Observatory, Russia are both shown below.
Moscow, RU temperature (top) and precipitation (bottom) Time Series for 90 Days Ending 12 August 2010
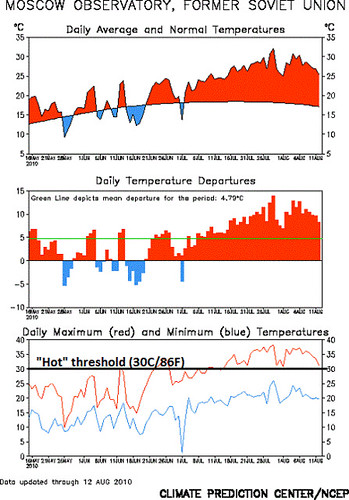
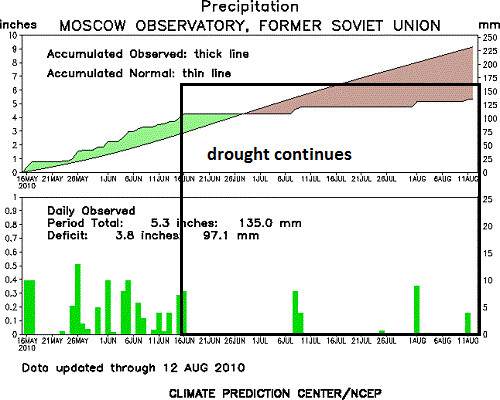
Temperatures have been consistently above the "hot" threshold since 11 July. There has been less than 25mm (1 inch) of rain since 16 June. Both are unprecedented at this location for over 130 years.
Other diaries have discussed the flooding in Pakistan. About 6 million are without water. Up to 20 million (about 8% or so) of the total Pakistani population is directly affected. Apparently, the Russian heat wave and Pakistani floods are related, according to Dr. Jeff Masters at WeatherUnderground. He cites a combination of sea surface temperature anomalies and anthropogenic climate change. I strongly recommend both his blog entry here and the other references at the end of his post.
NCDC Climate Summary for July 2010
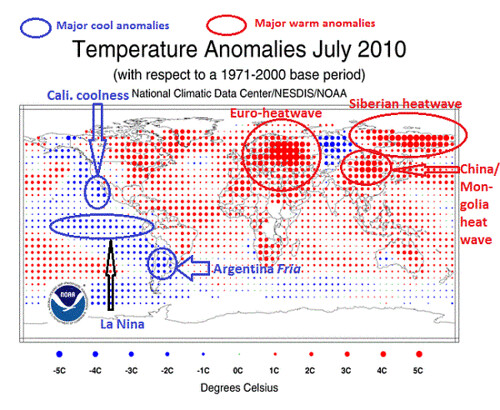
The climate summary for July 2010 was published on 14 August 2010. The global temperature and precipitation anomalies for the month, compared to the 1961-1990 means, are shown below. I've annotated them with the important anomaly features.
Global Temperature Anomalies: July 2010
Global Precipitation Anomalies: July 2010
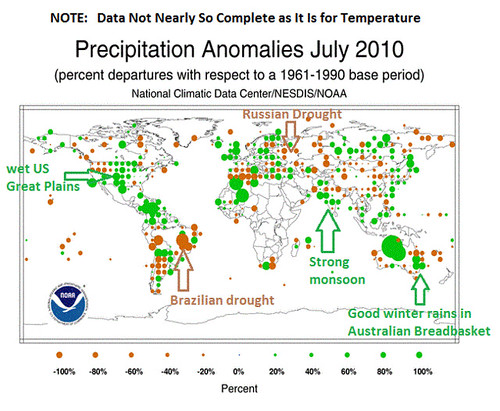
Note how almost universally hot the landmasses in the Northern Hemisphere have been in July. The monsoon in Asia was stronger than normal in the Indian sub-continent (including Pakistan), as indicated by the rainfall anomalies there. The good winter rains in southeastern Australia will help with the grain shortages resulting from the Northern Hemisphere heat waves and drought, as well as those in the U.S. Great Plains. The cold weather in Argentina and adjacent South American countries is shown as well, along with the cool summer that California has experienced. These maps illustrate why we cannot draw conclusions directly about climate change from an individual month or area.
But the integrated change over time tells us more. Time series of global temperature since 1880 is shown next.
Global Temperature Anomaly Tims Series of July Monthly Mean Temperature, 1880 to 2010
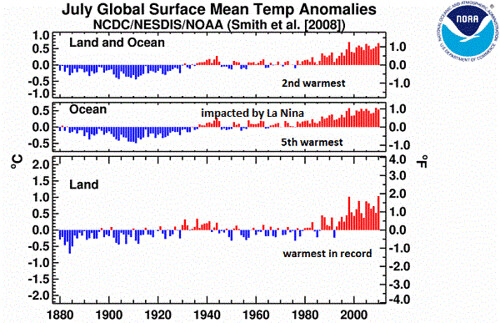
Over land, it was the warmest July in the 131 year record. Over the globe including the oceans, it was second warmest (warmest was the super El Niño year of 1998). The global oceans were only 5th warmest, because of the strengthening La Niña in the equatorial Pacific. This La Niña, which is expected to continue through at least winter 2010-2011, will contribute to a cooling to the global mean temperature as long as it lasts.
Concluding Remarks
It's clear to most, I believe, that something is going on with our climate. Extremes like we've experienced in recent months (if not years) have tended to one side: warming. The graphic below from Climate Progress only goes back through the 1950s, but tells an interesting story:
Ratio of Record Highs to Record Lows in the U.S. by Decade: 1950s to 2000s
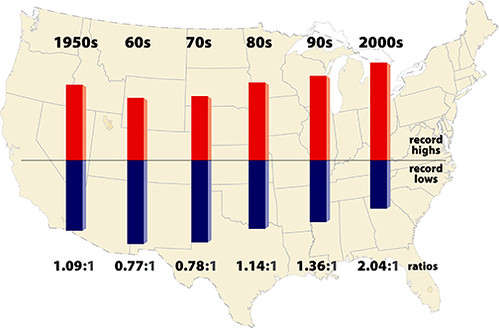
We see the relative cool spell in the 1960s and 1970s when high to low records were less than one-to-one. In the 2000s, they ran two plus-to-one. In Spring 2010, it was similar. As Climate Progress explains, this is especially impressive in light of the decrease in total solar irradiance (TSI). We can see the TSI from the Laboratory for Atmospheric and Space Physics (LASP) here. Note that TSI is beginning to recover from its low point, finally, after a longer-than-expected minimum.
So we can expect solar forcing of global warming to increase over the next half-decade. And we surely know what's happening with CO2 and perhaps with CH4 (methane). It would be fabulous if something like this (confession: I've not really done more than scan this entry.) would allow us to start using CO2 as the source for carbon-based fuel, effectively sequestering it. But such technologies are decades away; in the meantime, it appears that we will continue to do our carbon dumping, because of a lack of political will to do what is necessary to prevent this slowly unfolding catastrophe from becoming an "inconvenient" reality (apologies to Al Gore).
