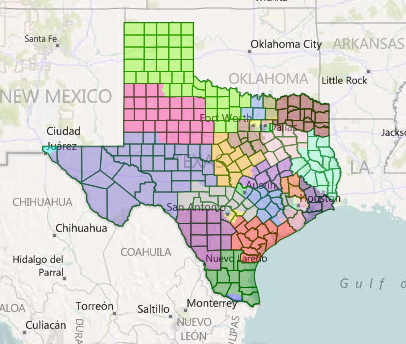
Texas recently failed to pass a congressional redistricting plan. While this probably just means that it will be done in a special session or ruled on by a very republican judge, I wondered what might happen if someone impartial drew the lines in such a crucial state. Some sacrifices had to be made for population equality, but I believe this map is generally fair and non-partisan. Population deviations under a thousand, and all demographic info is VAP.
O=Obama
D=Average Dem Performance
W,H,B,A= White, Hispanic, Black, Asian
District 1 (Blue): 69.0% O, 66.6% D, 87.7% H
Contains most of Hidalgo County, centered on McAllen. Safe D 1-0-0
District 2 (Green): 66.5% O, 66.3% D, 88.6% H
Another overwhelmingly Hispanic border district. Safe D 2-0-0

District 3 (Purple): 58.2% O, 57.5% D, 73.2% H
This border district goes from Laredo to Bexar County, with a few little pieces of San Antonio proper. Likely/Safe D. 3-0-0
District 4 (Red): 40.1% O, 43.9% D, 47.6% H, 45.3% W
This Corpus Christi based district will surely go Republican for now, but this district will shift towards democrats in the future. 3-1-0
District 5 (Yellow): 56.5% O, 54.5% D, 59.9% H
This district has parts of San Antonio and parts of the eastern suburbs. Likely D. 4-1-0.
District 6 (Teal): 51.6% O, 46% D, 51.8% H
This district is almost entirely in San Antonio (the lines aren’t clear to say the least. It may be all inside.) but is historically Republican. It is trending towards us quickly, and voted for Obama, but that 46% D is forcing me to label this one a toss-up against my instincts which want to label this tilt-d. 4-1-1
District 7 (Gray): 34.1% O, 30.4% D, 65.5% W
The conservative northern San Antonio suburbs/exurbs. Safe R. 4-2-1
District 8 (Slate Blue): 31.6% O, 33.4% D, 49.3% H, 45.5% W
This border district also contains Odessa and Midland and San Angelo, outweighing the border counties and those by El Paso. Safe R for 20 years due to the mid sized heavily R cities, but shifting our way. 4-3-1
District 9 (Sky Blue): 65.7% O, 62.2% D, 78.1% H
El Paso. Safe D. 5-3-1
District 10 (Deep Pink): 28.3% O, 30.2% D, 62% W
Lubbock and Abilene and empty space. 5-4-1
District 11 (Chartreuse): 22.6% O, 26.9% D, 70.4% W
Lots of nothing. 5-5-1
District 12 (Cornflower Blue): 34.8% O, 29.5% D, 71.1% W
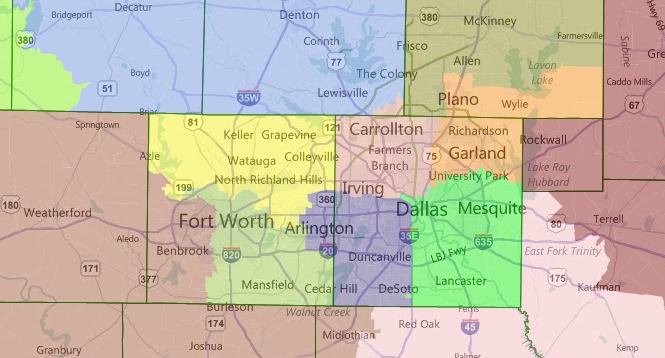
Northern DFW Suburbs. 5-6-1
District 13 (Tan): 45.5% O, 37.9% D, 50.1% W, 30.6% H
Irving and Carrolton, trending towards us pretty rapidly but still Likely D for now. 5-7-1
District 14 (Olive): 35.2% O, 28.6% D, 70.5% W
NE DFW Suburbs. 5-8-1
District 15 (Dark Orange): 45% O, 38% D, 51.7% W, 23.5% H, 13.5%
Another district dems will be competitive in in 2020. 5-9-1
District 16 (Lime): 70.1% O, 65.7% D, 33.9% H, 31.8% B, 31.1% W
The district dems are most likely to hate, it ends up being a Dallas vote sink. 6-9-1
District 17 (Dark Slate Blue): 67.7% O, 62.8% D, 40.4% H, 28.8% B, 25.7% W
Another district that ends up being a dem vote sink. 7-9-1
District 18 (Yellow): 35.2% O, 30.3% D, 70.2% W
The city lines are unclear, but this appears to be mostly the suburban parts of Tarrant County and not Forth Worth proper. 7-10-1
District 19 (Yellow Green): 53.2% O, 49.4% D, 44.9% W, 29.6% H, 19.5% B
South Fort Worth and Arlington. Leans D, and will get even more friendly with time. 8-10-1
District 20 (Pink): 29.1% O, 31.7% D, 70.1% W
SE DFW Suburbs. 8-11-1
District 21 (Maroon): 30.1% O, 37% D, 75.3% W
From DFW to the border with Arkansas and Louisiana. 8-12-1
District 22 (Sienna): 30.7% O, 31.5% D, 76.5% W
SW of DFW. 8-13-1
District 23 (Aquamarine): 29.5% O, 37.3% D, 73% W
Runs along the Louisiana border. 8-14-1.

District 24 (Indigo): 41.1% O, 46.1% D, 60.4% W
Beaumont and areas east of Houston. Much more democratic at local level than federal but still likely R. 8-15-1
District 25 (Pale Violet Red): 45.4% O, 42.5% D, 45.2% W, 23.2% H, 18.5% B, 11.6% A
This district will be competitive in 2020. Without a fantastic candidate, it isn’t today. 8-16-1
District 26 (Gray): 37.4% O, 31.1% D, 49.8% W
This is another of those districts that will be competitive in 2020. 8-17-1
District 27 (Spring Green): 52.1% O, 46.5% D, 37.4% H, 28.2 W%,
Leans Dem due to the demographics. Any district with only 28 percent VAP white population that went to Obama leans Dem. 9-17-1
District 28 (Plum): 53.5% O, 53.2% D, 46.8% H, 32.7% W
This district will only get more dem friendly as time goes on. 10-17-1
District 29 (Dark Sea Green): 57.7% O, 53.2% D, 44.1% W, 25.6 H, 21.3% B
Likely D and will be safe D soon. 11-17-1
District 30 (Light Coral): 58.5% O, 58.7% D, 50.3% H
All Harris county, should be fairly safe. 12-17-1
District 31 (Khaki): 49.7% O, 43.7% D, 34.5% H, 34.1% W, 23.4% B
North Houston, the most swingy part. Toss-up, although republicans would be favored initially in 2012. 12-17-2
District 32 (Orange-Red): 25.9% O, 23.9% D, 72% W
Safe R district north of Houston. 12-18-2
District 33 (Royal Blue): 59.1% O, 57.3% D, 49.3% W, 35.2% H
Stretches from Austin to west of Houston. One of the ugliest seats on the map, imo. 13-18-2
District 34 (Lime Green): 56.9% O, 48.3% D, 67.3% W
Austin based district. Likely D. 14-18-2
District 35 (Dark Orchid): 37.5% O, 34.7% D, 66.3% W
College Station and Temple are the two largest cities in this solid R district. 14-19-2.
District 36 (Orange): 36.7% O, 37.5% D, 64.5% W
Waco is easily the largest city in this leftover district. 14-20-2
The current Texas delegation is 23-9. This map would be a 21-15 or so, which is a much more accurate representation of Texas.
