PIOMAS, the Pan-Arctic Ice Ocean Modeling and Assimilation System, is a model of Arctic ocean ice volume maintained by the Polar Science Center at the University of Washington. Basically, they look at satellite images of Arctic Ocean ice and determine its thickness by its color. This is a fundamentally different way of measuring Arctic Ocean ice that the commonly seen sea ice extent graphs like this one from the National Snow and Ice Data Center:
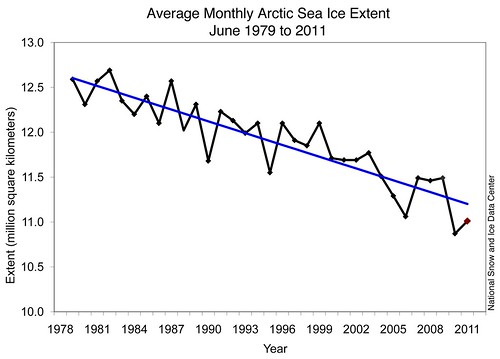
The difference is because most of the Arctic sea ice loss has been in thickness rather than extent (or area). So if you focus on extent only, you're missing most of what's happening.
That's why the PIOMAS data on ice volume is important; volume is a better measure of how much Arctic ice has really been lost. You may have seen their widely-published anomaly graphs like this one:
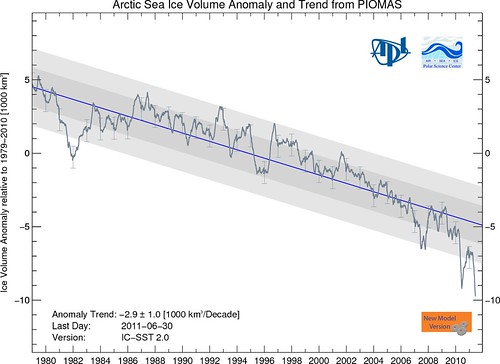
... which is pretty awful itself. But this graph only shows you the anomaly, which is how much the ice volume right now differs from the average ice volume for this time of year (based on some historical average). Which is fine, but it doesn't tell you the raw numbers.
Recently, however, UW PSC published the data from which this graph is derived, and the data is quite revealing – and frightening.
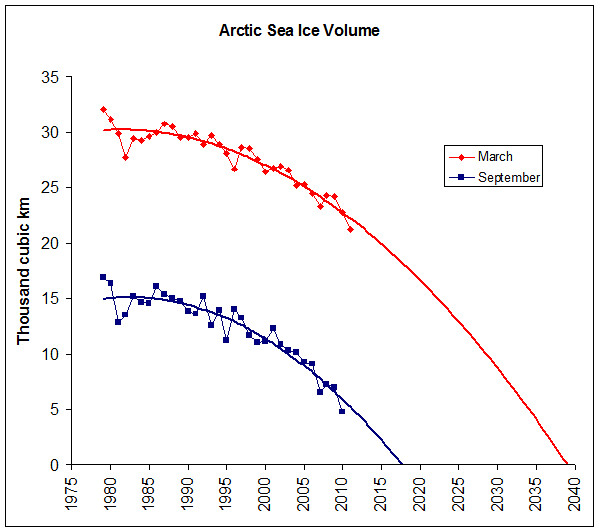
The ice volume data is given daily for every day since 1979, so I started by averaging each month. The month that has the greatest average volume is March (end of winter, no surprise) while the month with the least average volume is September (end of summer, again no surprise).
The surprise comes when you look at the absolute values (rather than anomalies) for September, as shown on the graph above the fold. Not only is the volume falling off a cliff (declining, and accelerating as it declines), but we've only got a few years left before we hit zero sea ice volume in the Arctic Ocean at the end of summer.
I've added a quadratic fit to the data, and the curve hits zero in about 2018, just seven years from now. Given the uncertainty in the data, the actual zero point could be a few years either way from that projection – but probably not by much.
I've also plotted sea ice volumes for March, along with its quadratic trend, which hits zero in about 2039. After that point, there won't be any sea ice in the Arctic at any time of the year, even in the dead of winter. The Arctic Ocean will look a lot like the Southern Ocean instead.
If you think the weather is weird now, wait until the polar ice cap is replaced with dark, sunlight-absorbing open ocean surface.
UPDATE: From Community Spotlight to the Rec List? You guys are the greatest.

