Well, I'm back with another round of redistricting ideas. I know my first foray was sucky, but this time I've come back with better form. I've started anew.
Anyway, this time I'll be doing a redistricting diary on West Virginia. A state where Dems have a nearly 2:1 (~54% to roughly 29% to be exact) registration advantage. They control all statewide offices and have a lopsided majority in the state legislature (65-35 in the House, 28-6 in the Senate). Of course, the lion's share of them are conservative (in the primary for Governor this year, there was only one candidate who was overtly pro-choice). It's probably the only state where a Democrat can lose a primary challenge from the right (see Mollohan vs. Oliverio). However, despite the conservative lean of the state, the WV GOP hasn't caught a break since the days of Arch A. Moore. Their only recent accomplishment to celebrate is narrowly winning WV-01 last fall. This diary will have redistricting ideas that could move things back to a 2-1 or even 3-0 Dem advantage.
More below the fold.
From what I have heard in the scanty reporting on this matter, the committees have been drafting maps during the month of July and will have an August special session to consider and approve them.
It should also be noted that Senate Majority Leader John Unger (D-Berkeley), Chair of the Senate Redistricting Committee, has been very open with the process. His committee held hearings in every key county in the redistricting and reapportionment preliminary stage. What this means for both parties is uncertain, but it seems that they'll avoid being egregious and put communities-of-interest first where possible.
Most importantly, West Virginia has a whole-counties provision in their state constitution and, according to Ballotpedia, their maximum allowed deviation is 0.22% (1359 people). While my first hypothetical scenario exceeds it, my second scenario does not.
In drawing these maps, I used the county-by-county Senate special election results between then-Governor Joe Manchin and steel tycoon/occassional WV resident John Raese (h/t The NY Times ). Under the current maps, Manchin won in all three congressional districts. Each district I created was gauged solely as a percentage of the two-party vote (hence, the performance of the Mountain and Constitution Parties are excluded). Afterwards, I found the partisan registration numbers for each county in West Virginia (h/t the WV SoS website ). No changes were made based on the partisan numbers since they, for the most part, reflect the performance of Manchin and Raese.
Scenario 1: Vote-Sinking WV-02
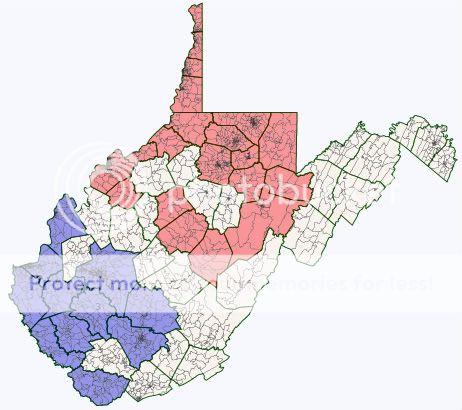
Using the Manchin vs. Raese results, I added more Democrats to WV-01, had WV-02 take as many Raese counties as possible, and had WV-03 take the rest. I also put Shelley Moore Capito's home (Charleston in Kanawha County) in WV-03. WV-03 is pushed westwards, but is still centered in coal country, so Nick Rahall won't be irked. Finally, I left Rep. McKinley's hometown of Wheeling in WV-01, but under these new lines, Dems can definitely take him on.

For WV-01, I cut out the Republican counties of Grant, Mineral, Doddridge, and Ritchie. It compensated by picking up the Democratic counties of Randolph, Webster, Braxton, and Wirt. WV-01 no longer enters the Eastern Panhandle.
Statistics:
56.5% Manchin, 43.5% Raese
94.6% White, 2% Black, 1% Hispanic, 0.8% Asian, 0.2% Native American, 1.3% Other
Deviation: -1675

For WV-02, all of the counties dropped by WV-01 are picked up and WV-02 now takes all of the Eastern Panhandle. To cause Shelley Moore Capito frustration, I took out her home of Kanawha County. However, that also took away quite a bit of population. Therefore, I had WV-02 take some of the softer Dem counties from WV-03 (except for Rahall's home of Raleigh County, of course). This district now is one that voted for Raese over Manchin.
Statistics:
49.4% Manchin, 50.6% Raese
93.1% White, 3% Black, 1.7% Hispanic, 0.5% Asian, 0.2% Native American, 1.4% Other
Deviation: +3210

For WV-03, I squeezed it into the southwest corner of the state, a region just as Democratic as its regional neighbor, eastern Kentucky. Joe Manchin won by a greater than 2:1 margin of the two-party vote in four counties here. I don't know if Rahall will like having Charleston in his district, but he already had Huntington, so he isn't averse to cities in his district.
Statistics:
59.7% Manchin, 40.3% Raese
91.8% White, 5% Black, 0.9% Hispanic, 0.7% Asian, 0.2% Native American, 1.5% Other
Deviation: -1536
Scenario 2: Drawn Together and Share the Wealth
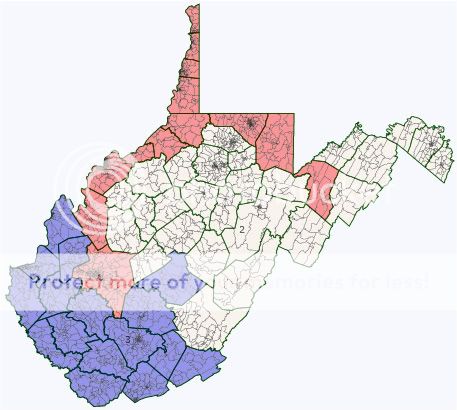
Now, we get more partisan. Here, I drew Reps. McKinley and Capito into the same district (WV-01). The new WV-02 takes the leftovers from the current WV-01 and WV-02 (as well as a few from WV-03). WV-03 is closer to its current cofiguration than in the previous scenario. Democratic strength is relatively even between WV-01 and WV-02, so Democratic opportunities are promising in both.

Here, I started with Capito's home of Kanawha and moved along the western âcoastâ northwards to the Northern Panhandle, the home of Rep. McKinley (and Acting Senate President Kessler). Most of the rest of the counties currently in WV-01 are carved out and put in WV-02. In order to have an acceptable population deviation, I had to include Grant County without using Tucker County as a bridge. Although it doesn't look like Preston and Grant County touch, rest assured that they do.

Statistics:
54% Manchin, 46% Raese
92.8% White, 3.5% Black, 1% Hispanic, 1% Asian, 0.2% Native American, 1.5% Other
Deviation: -1098

WV-02 is now Capito-less and includes WV's central counties and most of its Eastern Panhandle. It's less Democratic than the first, but not by much.
Statistics:
53.4% Manchin, 46.6% Raese
93% White, 3% Black, 1.8% Hispanic, 0.5% Asian, 0.2% Native American, 1.5% Other
Deviation: +488

Not much to say here. It loses Greenbrier and Pocahontas Counties and takes in a few western counties. Rahall should be happy with this. Let's just hope that his next Republican opponent doesn't use Rahall's Arabian heritage as fodder for an attack ad like âSpikeâ Maynard did.
Statistics:
58.5% Manchin, 41.5% Raese
93.7% White, 3.6% Black, 0.8% Hispanic, 0.5% Asian, 0.2% Native American, 1.2% Other
Deviation: +609
And that's all. I hope you like this far better than my previous diary, which was a amateurish first attempt at map-drawing.
With these maps, WV Democrats can gain back what they lost in 2010 (and maybe then some). I hope that those drawing the real maps have their proposals out soon so we can pore over them.
8:14 PM PT: Some articles from the past week on the process:
http://www.wvmetronews.com/...
http://wvgazette.com/...
Wed Jul 27, 2011 at 9:18 PM PT: Probably one of the most informative articles on this yet:
http://www.dailymail.com/...

