Suppose you had a bank account and every year deposited $10k. Lets say after 10 years, you decided to splurge and buy a car, so you don't make a deposit and instead attempt to withdraw $15k. And then, instead of giving you the money, the teller calls the manager over. After reviewing the situation, he declares your account insolvent because outflows are exceeding inflows and demands that you increase deposits or he won't give you any of your money...????
The trick about social security, the need to be vigilant, centers around the fact that it is currently in surplus: Excess social security revenue is use to fund the general budget. This excess revenue thus displaces otherwise required income taxes. In effect, a social security suplus enables an income tax cut, while a social security net-outflow requires payback: an income tax increase.
First question: What is the net social security surplus? Answer: $2.6T
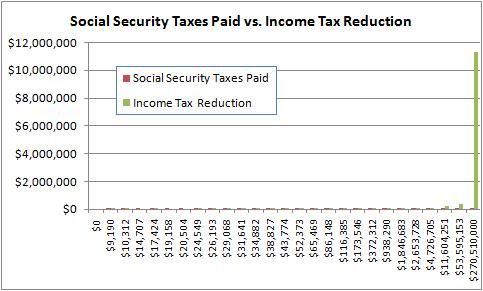
Second question: Who owes the money? Everyone, based on income tax rates. But, here is the devil in the details: since social security taxes are relatively flat while income taxes scale with income, the net beneficiaries of borrowing against social security are the people who pay the highest income taxes. This borrowing is a temporary transfer of wealth:

In the above chart, the red bars are the distribution of the social security surplus relative to amount paid in. If you're income is above about $150k, you're receiving more back as an income tax deduction than you are paying in. The above chart is totals by income range. Since not every income level has the same number of people in it, on a personal level it looks more like this:
Once social security switches from surplus to outflow, income taxes must be raised first to fund the general balance and second to repay what was borrowed. After all, it is only a loan if it is paid back. No new taxes, no pay back. Starting to see the bigger picture?
Just so you know what an insolvent social security system looks like, here it is:
If it looks like the curve is flattening, well it is. There were even brief periods where outflows did exceed incomes. This is obviosly scaring the people on the right side of the above charts because they already received the benefit of the payout and really really really really really really don't want to pay it back. After all, it is only a loan if you pay it back, otherwise it is a giveaway.
The sad part is the tea party tax protesters are mostly on the left side of the above charts. By making an income tax increase impossible, they are sealing the deal.
On a final note, social security will burn through its surplus by about 2032. This means the money above will have to be paid back by then. AFTER THAT, social security revenue HAS to be increased.
While it might be smart to not wait for the 2032 deadline and address it earlier, it only makes sense if you assume you will get paid back. Given the number of people on the left side of the wealth-redistribution charts protesting repayment, it seems unlikely right now.
Update:
What I mean by the above paragraph is, if we wait until 2032 we might find the need for a sudden increase in social security taxes in the middle of a recession. Increasing the surplus by either increasing inflows or reducing benefits isn't necessarily the smart thing to do either. Why do we need a 20 year pad on its balance sheet? We're already having a government shutdown threat over trying to get any part of the $2.6T owed paid back. Making Social Security more 'solvent' by increasing the surplus will only make the situation worse. A smarter move might be to burn down the surplus, then maintain it at a 5-10 year pad. Then we can make small adjustments on the fly based on current needs. For example, right now if we cut FICA taxes and increased income taxes with a break-even at $150k-ish income, that would reverse the money flow, putting money back where it is needed in the economy.
Of course, considering that this is the exact opposite of the republican proposals means...., hmmmm...
Peace.
PS, see my previous diary for calculation of the above charts. They are currently scaled to 2009 tax rates, but the story doesn't change much based on year selection.
Why We Need to Keep an Eye On Social Security

