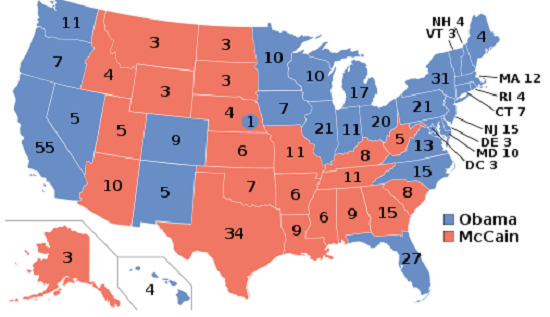
This is what it looked like in 2008. What will 2012 look like?
Political junkies don't have an "off year," of course. Many of us are already looking ahead to the state-by-state analysis of the 2012 presidential elections. Oh, sure, some of you might try to buzzkill by gently pointing out that we don't have anything close to a GOP nominee yet, or you may point to the calendar to remind us that the presidential election is still fifteen months away.
That said, it is useful to see what the landscape might look like in 2012. And the polling crew over at Gallup offered us a nice resource to do so earlier this week.
Every summer, Gallup aggregates their presidential job approval numbers for the first half of the year, and then break them down by state. It is a wide pool of interviews to draw from (90,000 over the six-month period), and offers us a look at several states that have seen scant polling thus far.
Now, I will be the first to admit that this is much more of an intellectual exercise than an infallible measurement of the state of the electoral map. After all, these interviews were culled over six months, and any public sentiment in January (or early May, post-OBL) certainly do not factor into where the public stands now, let alone where they will stand in November of 2012. Plus, the Republican nominee will undoubtedly factor into the calculus. If it is a fractious affair, or they nominate one of their trainwreck candidates, then the president can win even with subpar job approval.
That said, there is some merit in looking at these numbers. Historical analyses have long held that there is a pretty decent connection between an incumbent president's job approval and their basic fortunes as they seek reelection. Only Truman earned reelection with sub-45 percent job approval, and George W. Bush is one of the few others that has done so with sub-50 percent job approval.
Plus, there is some interest in seeing if the president's job approval numbers in some McCain '08 states merit consideration for addition to the target list. Conversely, it is also worthwhile to explore if any states in the Obama 2008 coalition appear to have drifted out of reach.
So, with that in mind, let's start with the baseline. Barack Obama sailed to the presidency in 2008 with a 365-173 victory in the Electoral College. Does that mean we start at 365 electoral votes? Well ... no, actually. The vagaries of the reapportionment process has already altered the map. If the president won exactly the same coalition of states (plus Nebraska's sole electoral vote from NE-02), he would now be sitting on a 359-179 victory.
Let's start with the following scenario based on the Gallup data. Let's give the president every state where his net job approval is either neutral, or in positive territory. In other words, let's only give the GOP those states in which Obama's job approval, as measured by Gallup, is underwater.
Under that scenario, President Obama loses the following states out of his 2008 coalition: New Mexico, Virginia, Ohio, Nevada, Colorado, Oregon, Indiana and New Hampshire.
We will, based on the 2008 disparities between NE-02 and the rest of the state, assume that Obama does keep that one electoral vote. Furthermore, he actually picks up a state from the McCain coalition, and it is a big one. His approval, according to Gallup, was actually in positive territory in Georgia.
Under that scenario, Barack Obama would be reelected by a 302-236 margin in the Electoral College:
Scenario #1: States distributed based on positive job approval for Barack Obama
BARACK OBAMA (302 EVs): California (55), Connecticut (7), Delaware (3), District of Columbia (3), Florida (29), Georgia (16), Hawaii (4), Illinois (20), Iowa (6), Maine (4), Maryland (10), Massachusetts (11), Michigan (16), Minnesota (10), Nebraska (1), New Jersey (14), New York (29), North Carolina (15), Pennsylvania (20), Rhode Island (4), Vermont (3), Washington (12), Wisconsin (10)
REPUBLICANS (236 EVs): Alabama (9), Alaska (3), Arizona (11), Arkansas (6), Colorado (9), Idaho (4), Indiana (11), Kansas (6), Kentucky (8), Louisiana (8), Mississippi (6), Missouri (10), Montana (3), Nebraska (4), Nevada (6), New Hampshire (4), New Mexico (5), North Dakota (3), Ohio (18), Oklahoma (7), Oregon (7), South Carolina (9), South Dakota (3), Tennessee (11), Texas (38), Utah (6), Virginia (13), West Virginia (5), Wyoming (3)
Don't get me wrong, I have my doubts about the GOP claiming a few of those states where Obama's first-half job approval was underwater. I don't see them claiming Oregon, to be sure, and I'd make the president a betting favorite in Colorado and Virginia, as well. That said, I am also skeptical of the president snagging Georgia, though with Atlanta in the mix, I suppose it is mathematically possible.
Let's switch gears now and go with the most pessimistic scenario: that President Obama only claims those states where his job approval currently sits at 50 percent or better. Under that theory, undecided voters haven't been swayed yet, thus they are unlikely to be swayed at all. I am a skeptic on this point, as well, but for the sake of seeing the worst-case calculations, let's run the numbers.
Under that scenario, Georgia reverts back to the GOP coalition. Several states in the Dem coalition join Georgia on the GOP side: North Carolina, Florida, Pennsylvania and Iowa (he'd also cough up the one EV in Nebraska). Thus, the electoral college would then float over to the challengers, as the GOP would claim a 307-231 lead in this variation on the electoral college:
Scenario #1: States distributed based on positive job approval for Barack Obama
BARACK OBAMA (231 EVs): California (55), Connecticut (7), Delaware (3), District of Columbia (3), Hawaii (4), Illinois (20), Maine (4), Maryland (10), Massachusetts (11), Michigan (16), Minnesota (10), New Jersey (14), New York (29), Rhode Island (4), Vermont (3), Washington (12), Wisconsin (10)
REPUBLICANS (307 EVs): Alabama (9), Alaska (3), Arizona (11), Arkansas (6), Colorado (9), Florida (29), Georgia (16), Idaho (4), Indiana (11), Iowa (6), Kansas (6), Kentucky (8), Louisiana (8), Mississippi (6), Missouri (10), Montana (3), Nebraska (5), Nevada (6), New Hampshire (4), New Mexico (5), North Dakota (3), Ohio (18), Oklahoma (7), Oregon (7), Pennsylvania (20), South Carolina (9), South Dakota (3), Tennessee (11), Texas (38), Utah (6), Virginia (13), West Virginia (5), Wyoming (3)
This scenario actually underscores one of the key structural advantages that the Democrats are gaining in the electoral college. In this scenario, President Obama would claim roughly 47 percent of the popular vote. He would lose 34 of the 51 contests at the statewide level. And he'd still be within striking distance (any coalition of 2-4 large states would do it) of winning reelection.
Where is the current state of the landscape? Perilously, it is probably somewhere in the middle, which means that President Obama is right on the precipice of victory or defeat. The four states he loses in the more pessimistic scenario are all key states, and they are all states where at least one poll in the past month or so has shown the president trailing a GOP challenger. However, as I stated earlier, I can also see 29 electoral votes in the GOP coalition in this analysis that are more likely that not to stay Democratic (CO/OR/VA).
Examining where President Obama's net job approval has shifted the most off of his margin of victory or defeat in 2008 yields some interesting results, though most of the results are of dubious value.
The reason? Most of the biggest shifts occur as a result of moderation of opinions in states that either went sharply for or against Obama in 2008. Therefore, three of the five states that drifted the furthest away from the president (Hawaii, Rhode Island and Vermont) are almost certainly going nowhere. Likewise, three of the five states where the president's approval numbers are better than his election totals in 2008 (Louisiana, Alaska and Oklahoma) are on absolutely no Democratic target lists.
That said, there are a few states to watch. According to Gallup, President Obama's public esteem in the potentially competitive Rocky Mountain region has taken a hit. Obama is considerably weaker in several states out west, along with one notable example in New England:
Marginal shift between 2008 election totals and 2011 job approval
Oregon: Obama -21 (from 57/40 in 2008 to 44/48 in 2011)
New Hampshire: Obama -21 (from 54/45 in 2008 to 40/52 in 2011)
New Mexico: Obama -16 (from 57/42 in 2008 to 46/47 in 2011)
Nevada: Obama -16 (from 55/43 in 2008 to 44/48 in 2011)
Colorado: Obama -13 (from 54/45 in 2008 to 44/48 in 2011)
Given that the president was elected in 2008 with 53 percent, and now sits in the mid-to-upper 40s in job approval, targets are a little harder to come by. The two best targets appear to be Georgia (47/52 in 2008; 48-44 now) and Arizona (45/54 in 2008; 44/48 now). Both South Carolina and South Dakota are also closer to parity than they were in 2008, so don't be surprised if they get at least some discussion next year.
The bottom line, as we have known for some time, the goal for team Obama is likely going to be preserving the 2008 coalition, rather than expanding it. Those are just the realities of running for reelection in what has to be described as hostile circumstances. The good news for the president and his supporters: The math, even at a very low ebb in his support, does not preclude a second term. In fact, he might still be a slightly better than 50/50 prospect to win reelection, based on this state-by-state examination.
