In my last diary, I looked at a regression analysis I performed at the precinct level of Rep. Baldwin's 2000 election, where she narrowly won by a 2-point margin even as V.P. Gore won her district by a wide 22-point margin.
A few people asked why I was looking at such an old election. I said it was because this was the last time she faced a serious G.E. challenger, and so it was the most recent piece of evidence I had. Still, let's look at her recent elections in 2010, 2008, and 2004. As usual, all my data comes from the Wisconsin Government Accountability Board: http://gab.wi.gov/...
2010:
In 2010, Baldwin faced Republican Chad Lee, while at the top of the ticket were races for Governor, United States Senator, Attorney General, Secretary of State, and Treasurer. However, Baldwin's precinct-by-precinct share of the vote is highly correlated with the share received by the Democratic candidate for Governor, Tom Barrett--in fact, their correlation coefficient is about 0.98.
First, the totals: There were 309,460 votes cast for Congress in Baldwin's district. Baldwin received 191,164 votes, beating Republican Chad Lee with 61.77% of the total district vote (There were no third-party candidates). There were 311,301 votes cast for Governor in Baldwin's district. The Democratic candidate for Governor, Tom Barrett, received 194,366 votes, beating Republican Scott Walker with 62.44% of the total district vote.
Baldwin, then, slightly under-performed Barrett both by total number of votes and by share of the vote.
Nor did she draw from different sources of strength than did Barrett--as I said, their percentages were highly correlated by precinct. Here is the results of a linear regression:
Call:
lm(formula = BaldwinPer ~ BarretPer)
Residuals:
Min 1Q Median 3Q Max
-0.178423 -0.017288 0.000069 0.016349 0.102792
Coefficients:
Estimate Std. Error t value Pr(>|t|)
(Intercept) 0.028479 0.005745 4.957 1.1e-06
BarretPer 0.949832 0.009333 101.766 < 2e-16
---
[...]
Residual standard error: 0.02991 on 363 degrees of freedom
Multiple R-squared: 0.9661, Adjusted R-squared: 0.966
F-statistic: 1.036e+04 on 1 and 363 DF, p-value: < 2.2e-16
(There were a few precincts that split their tickets, of course, despite this.)
Here is a graph:
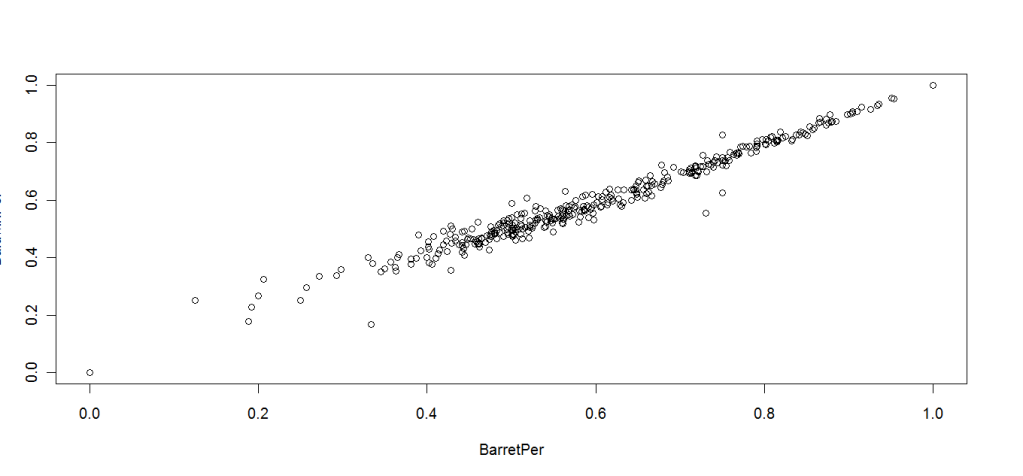
(Sorry about the typo in Barrett's name and the cut off Y-axis.)
2008:
In 2008, Baldwin faced Republican Peter Theron, while the Presidential race was at the top of the ticket. There were 400,841 votes cast for Congress in Baldwin's district. Rep. Baldwin received 277,914 votes, beating Theron with 69.33% of the vote.
There were 415,476 votes cast for President in Baldwin's district. Then-Sen. Obama received 286,086 votes, beating Sen. McCain with 68.86% of the total district vote.
Baldwin, therefore, slightly over-performed Obama by share of the electorate.
Baldwin's share of the electorate was also a bit less well-correlated with the top of the ticket in 2008 than in 2010--the correlation coefficient between Baldwin's precinct percentages and Obama's is "only" about 0.95, and here is the linear regression:
Call:
lm(formula = BaldwinPer ~ ObamaPer)
Residuals:
Min 1Q Median 3Q Max
-0.48393 -0.01806 -0.00230 0.01607 0.17768
Coefficients:
Estimate Std. Error t value Pr(>|t|)
(Intercept) 0.05802 0.01040 5.581 4.69e-08
ObamaPer 0.92590 0.01508 61.388 < 2e-16
---
[...]
Residual standard error: 0.04151 on 364 degrees of freedom
Multiple R-squared: 0.9119, Adjusted R-squared: 0.9117
F-statistic: 3768 on 1 and 364 DF, p-value: < 2.2e-16
Here is a graph:
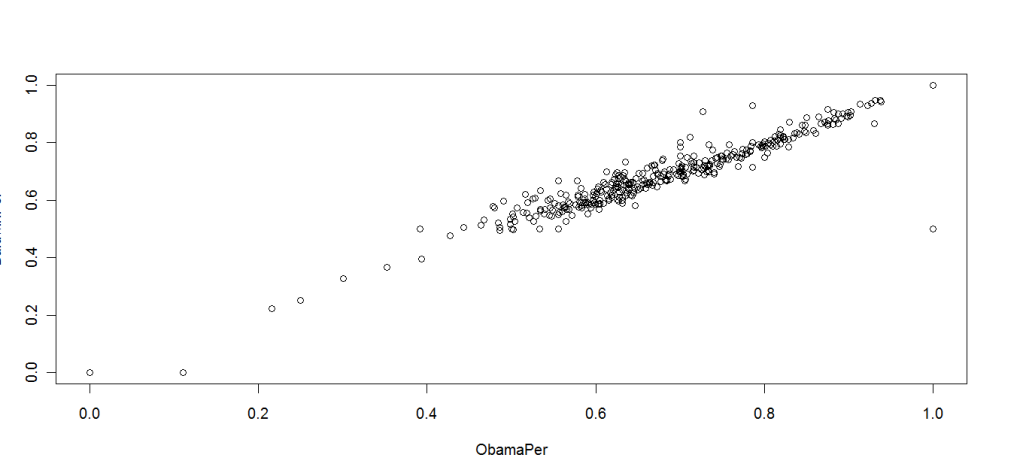
Looking at specific precincts where Baldwin got a higher share of the vote than Obama, there is, for once, a regional trend I can notice despite not knowing where towns are in relation to each other: the city of Beloit. Indeed, Baldwin received 73.97% of the vote in Beloit, while Obama received 68.48%. I'd be curious if there's anything that makes Beloit stand out--that's a decent share of the difference between their shares on its own.
2004:
Rather than a precinct analysis of the 2004 election, I will instead show the Democrats in districts then-Sen. Kerry won by at least 16 points, sorted by "Candidate Margin-Kerry Margin":
1 GA 4 McKinney (Open Seat) (D) -15.4
2 MO 5 Cleaver (Open Seat) (D) -8.9
3 WI 4 Moore (Open Seat) (D) -8.6
4 VA 8 Moran (D) -6.2
5 IN 7 Carson (Julia) (D) -5.4
6 MI 13 Kilpatrick (D) -2.3
7 MD 4 Wynn (D) -2
8 MS 2 Thompson, Bennie (D) -1.2
9 CA 9 Lee (D) -0.7
10 MN 4 McCollum (D) -0.7
11 CA 8 Pelosi (D) 0.5
12 PA 2 Fattah (D) 1
13 WA 7 McDermott (D) 1.4
14 WI 2 Baldwin (D) 1.6
15 MD 7 Cummings (D) 1.8
16 MN 5 Sabo (D) 2.3
17 CA 12 Lantos (D) 2.3
18 RI 1 Kennedy (D) 2.3
19 CA 6 Woolsey (D) 2.4
20 CA 39 Sanchez, Linda (D) 2.4
(h/t: My own comment and this classic SSP diary giving Presidential results by CD:
http://www.swingstateproject.com/...)
Conclusion:
I think it's odd that Baldwin got a slightly lower share of the vote than Barrett did in her district in 2010 but a slightly higher share of the vote than Obama did in 2008. But the differences are small--and I think the real story is that Baldwin's G.E. performances since 2000 seem closely tied to the top of the ticket, at least the ones I've looked at. Many essentially unchallenged incumbents in safe districts widely out-perform the top of the ticket, I think (and certainly this was the case in 2004). With some exceptions, Baldwin doesn't seem to generate a lot of ticket-splitting (or whatever you call it when opponents only bother voting for President.) Some of that might be the high-turnout nature of the district, some of that might be Baldwin's ideology, some of that might be Baldwin's campaigning--I really don't know.
Does Baldwin have any unexpected bases of support? I don't know. But here are the wards where she got larger shares of the vote by at least 1% than both Obama in 2008 and Barrett in 2010 (assuming I got my cross-referencing right):
County City+Ward
********
Columbia City Of Columbus Wards 1 - 8
Columbia City Of Lodi Wards 1 - 4
Columbia Town Of Columbus
Columbia Town Of Courtland Wards 1 & 2
Columbia Town Of Fort Winnebago Wards 1 & 2
Columbia Town Of Lewiston Wards 1 & 2
Columbia Town Of Otsego
Columbia Village Of Cambria
Columbia Village Of Doylestown
Columbia Village Of Friesland
Dane City Of Madison Ward 31
Green City Of Monroe Wards 1 - 10
Green Town Of Clarno Wards 1 & 2
Green Town Of Jefferson Wards 1 - 3
Green Town Of Jordan
Green Village Of Albany Wards 1 & 2
Green Village Of Browntown
Jefferson City Of Fort Atkinson Wards 1 - 3
Jefferson City Of Fort Atkinson Wards 4 - 6
Jefferson City Of Fort Atkinson Wards 7 - 9
Jefferson City Of Jefferson Wards 1 - 8
Jefferson City Of Whitewater Wards 9 - 11
Jefferson Town Of Aztalan Wards 1 & 2
Jefferson Town Of Cold Spring Wards 1 & 2
Jefferson Town Of Hebron Wards 1 & 2
Jefferson Town Of Jefferson Wards 3 - 5
Jefferson Town Of Koshkonong Wards 1 - 5
Jefferson Town Of Lake Mills Wards 1 & 2
Jefferson Town Of Milford Wards 1 & 2
Jefferson Town Of Sumner
Rock City Of Beloit Ward 10
Rock City Of Beloit Ward 11
Rock City Of Beloit Ward 15
Rock City Of Beloit Ward 16
Rock City Of Beloit Ward 17
Rock City Of Beloit Ward 19
Rock City Of Beloit Ward 3
Rock City Of Beloit Ward 7
Rock City Of Janesville Ward 26
Rock Town Of Avon
Rock Town Of Fulton Wards 1 - 4
Rock Town Of Magnolia
Rock Town Of Newark Wards 1 & 2
Rock Town Of Porter
Sauk City Of Baraboo Ward 1
Sauk City Of Baraboo Ward 10
Sauk City Of Baraboo Ward 14
Sauk City Of Baraboo Ward 3
Sauk City Of Baraboo Ward 6
Sauk Town Of Delton Wards 1 - 4
Sauk Town Of Fairfield Wards 1 & 2
Sauk Village Of Lake Delton Wards 1 - 3
Walworth City Of Whitewater Wards 1 & 2
Walworth City Of Whitewater Wards 3 & 4
Walworth City Of Whitewater Wards 5 & 6
Walworth City Of Whitewater Wards 7 & 8
Wisconsin residents--any interpretation of those wards? Note: I originally had a longer list, but decided to replace it with this shorter and probably more significant one. Also corrected a few typos--thanks, IllinoyedR--and checked the numbers and calculations.
I also forgot to mention that I omitted one precinct that cast three votes for President but no votes for Congress from the regression, since it had no value for Baldwin's share. Also, in the cross-referencing, the city of Jefferson had two precincts in one election for wards 1-8 and just one in the other election; however, Baldwin got the requisite higher share in both.
(Let me just apologize, btw, if there are any errors above--I'm trying to learn how to write and post diaries a bit more quickly, so it's possible I made some mistakes. And, again, I am indebted to the following explanation of how to do regression analysis in R:
http://www.gardenersown.co.uk/....)
