The next time your Republican uncle tells you that increasing taxes is bad for the economy, be sure to tell him that's he's right. And that he's wrong. It all depends on whose taxes you increase.
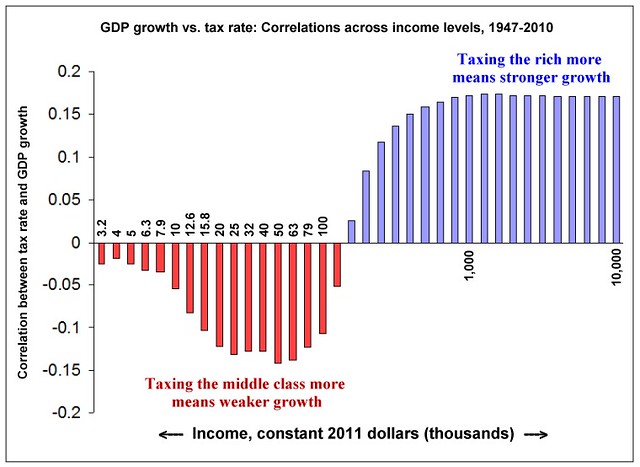
Any Keynesian economist would look at this graph and say, "Well of course! That's just what we expect." Basically, the graph shows that when you tax the middle class more, you get weaker growth, and when you tax the rich more, you get stronger growth. Follow below the arabesque to find out why.
When you get a dollar, there are only two things you can do with it: you can spend it, or you can save it. Those two paths lead to very different economic outcomes. Spending the dollar means you get something real in the real world: a pair of shoes, a haircut, a new car. Saving the dollar means you don't get any of those real things. Instead, you get a bank statement (or a 401K statement, or a brokerage statement) that says you own a dollar. I'm going to call these two paths the real economy (which is spending) and the paper economy (which is saving).
GDP (Gross Domestic Product) is the best measure of how the economy is doing overall, but what is GDP exactly? Simple: GDP is spending, and nothing but spending. GDP is the real economy in a nutshell. When spending goes up, that is a basic measure of demand in the economy. More spending means more demand for goods and services, so businesses hire more and the economy expands. Less spending means less demand for goods and services, so business lay off, and the economy shrinks.
There are three big components of GDP: consumer spending (the largest part), business spending on new plant and equipment (which is called Gross Investment by economists, but it's still spending for real things) and government spending. There's also an import/export adjustment, which is small.
That means if the GDP is to grow, spending in the real economy must grow. So how can that happen? One way is to increase the money supply by printing new money; but that has the downside of causing inflation. Another way is to increase the loan rate.
When you get a loan (let's say for a car), the bank checks your credit and if you're a good risk, they give you a check for, say $20,000 which you use to buy the car. The bank gets the money from the deposits of people who have saved. So by giving you the loan, the bank has moved $20,000 out of the paper economy and into the real economy. That increases spending by $20,000 which increases GDP by $20,000.
The key point: anything that moves money out of the paper economy and into the real economy is good for GDP. The reverse is also true: anything that moves money out of the real economy and into the paper economy is bad for GDP. When you pay back that car loan, that's $300 a month you don't have to spend on dining out, new shoes, or toys for the kids. So a loan is like a big BANG of economic stimulus, followed by a long slow hiss of economic drag as you pay it off.
Now consider the effect of taxation. If you're poor or middle class, chances are you spend nearly every dime that comes in. If you have savings, it's not much, at least not compared to what you spend. So if the government takes a dollar out of your pocket, that's a dollar you won't spend.
Now if the government turns around and spends that dollar itself, it's a wash: the dollar you don't spend gets spent anyway, and total spending (GDP) remains the same. But chances are, the government won't actually spend all of that dollar in the real economy: the government has debts too, and has to pay interest and principal to service those debts. If the government's debt service is greater than yours (which is generally true if you're middle class) then the dollar the government taxes away from you will end up being spent more in the paper economy than it would have if they never taxed it in the first place. In other words, the government will spend less of the dollar in the real economy that you would have. That means the real economy takes a hit with that taxed dollar, and GDP goes down. That's reflected in the red bars in the graph above.
But, as F. Scott Fitzgerald said, the rich aren't like you and me. A rich person spends a small fraction of his income in the real economy. Mostly what he does with his money is savings. He might call that "investment" because he's buying stocks and bonds and mutual funds, but that's not the same thing as "Gross Investment" when a business buys new plant and equipment; in economic terms, he's socking away his money, i.e., saving it in the paper economy. He just has a brokerage statement instead of a bank statement, but it's just as much paper.
So when you tax a rich person more, his spending doesn't go down much at all. He's still going to eat lobster and wear Gucci. Instead, he will pay the tax bill by saving a little less. And when the government gets the rich person's dollar, the government is going to spend most of it in the real economy. In effect, the government is moving money out of the paper economy and into the real economy by taxing the rich guy. And anything that moves money out of the paper economy and into the real economy will stimulate GDP, just like the loan did. But the difference between the loan and the tax is huge: the dollar taxed from the rich guy doesn't have to be paid back. Taxing the rich therefore has the same big BANG of stimulus as the loan, but without the long slow hiss of economic drag at the end.
That's why the blue bars at the right end of the graph (the incomes of the rich) show positive correlations between tax rate and GDP growth. When you tax the rich more, you're moving more money out of the paper economy and into the real economy, and GDP goes up.
The economic mess, and how to get out of it
Normally the way we get out of a recession is for the Fed to lower interest rates. That has the effect of stimulating more loans, which cause a lot of those BANGs that gin up the GDP.
But the current recession is different. The Fed has already lowered interest rates to essentially zero, and they can't go any lower. So more loans ain't gonna happen.
That means we need more spending from other sources, and since consumers can't, because they have no jobs, and business is afraid to, that leaves government spending as the last resort.
So let's see if you've been paying attention. Since we need government spending to pull us out of the recession, which of these is the best policy?
a) government borrows the money and spends it.
b) government taxes the middle class and spends it.
c) government taxes the rich and spends it.
If you said (c), you win the kewpie doll.
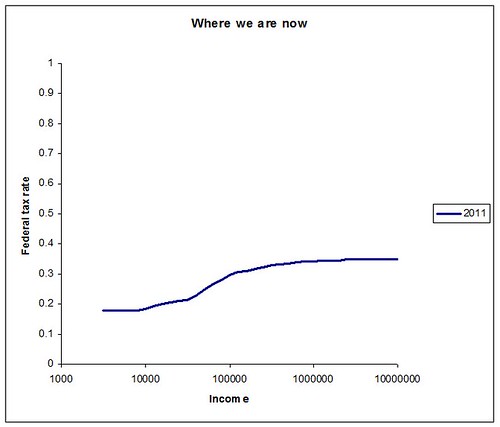
Can we do it?
Here's our current income tax structure: a nearly flat tax.
There are 64 years in the period 1947-2010, which breaks down neatly into quartiles. Here are the tax structures during the top 16 years for GDP growth:
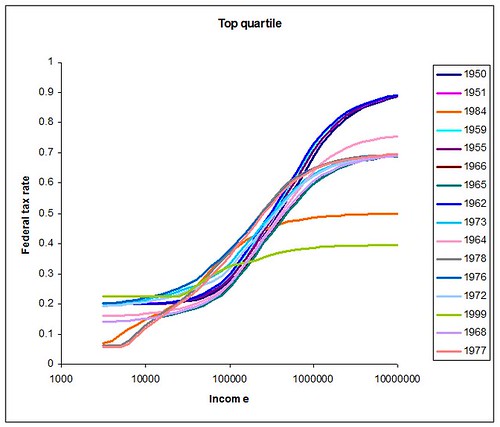
See any difference between these? I thought so. Not many flat taxes there. Now here's the bottom quartile: the tax structures in the worst 16 years for GDP growth.
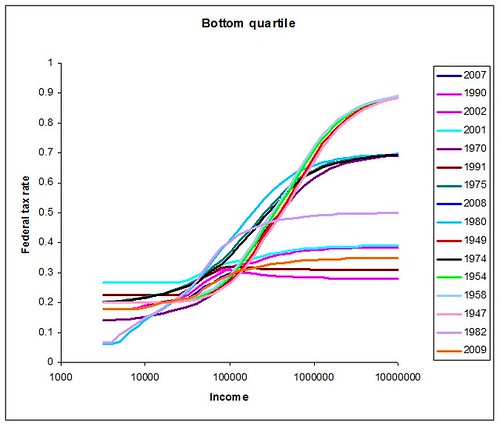
Hmmmm. A few progressive years, but mostly it's flat-tax city. 'Nuff said.
Sources for the graphs
I started with two spreadsheets from the Tax Foundation: first, their income tax rate history; and second, payroll tax rate history (which is Social Security and Medicare). The income tax rate history includes an inflation adjusted section (in constant 2011 dollars) which I used in the graph. The payroll tax spreadsheet does not correct for inflation, so I corrected for it myself using the same annual CPI numbers found in the income tax history spreadsheet.
Having those data, it is possible to compute the unadjusted tax rate (in any given year) for any given income level. In the early days there was only one filing method, which is comparable to today's married filing singly; so I used the married filing singly rates throughout. Because there are a lot of income levels, I simplified things by using a logarithmic scale: I started with an income of 103.5, or $3162, then went to 103.6 =$3981, and so on, up to 107 =$10,000,000. I computed income tax and payroll tax in constant 2011 dollars for each such income level using the tax brackets for each year, and a final tax rate for both combined.
From the Bureau of Economic Analysis, I found real GDP growth rates for each year (in two spreadsheets: pre-1969 and 1969-present; in both cases you need Section 1 data).
Then I just ran a correlation between GDP growth and total tax rate (income tax plus payroll tax) for each income level for all years 1947-2010. You can include earlier years if you want, but the gigantic up-and-down swings of the depression and war years (and the huge 1946 postwar recession) swamp the more meaningful modern data.
(I actually computed up to 108, or $100 million, but things didn't change for incomes that high: correlations still look postive by about the same amounts.)
Obviously this doesn't account for a lot of things, like tax deductions, tax credits, and so forth, so you'll have to remember that your taxable income and your gross income are two different animals. So while median individual income in the US is about $39,000 and median household income is about $50,000 you should subtract 12 to 15k (standard deduction plus a bit more) to get something like 25k to 35k for the median taxable income for individuals and households. Very rough, but that should be about right.
And of course, the correlations are rather weak: only at incomes above $600K or so are they statistically significant at the 90% confidence level.
But with those caveats, it's still pretty neat that the graph shows just what one would expect. At the far left end, taxing the poor has almost no effect on GDP (because the small amount of money they make has a tiny influence on the economy). The middle class (upper, middle and lower) is where the action is for consumer spending; taxing them is bad for GDP. The upper class is where the action is for saving; taxing them is great for GDP.
3:07 PM PT: Rescued? AND recommended? And 14 hours after posting it? You guys are, without a doubt, the greatest.

