Virginia is one of the few states left to complete redistricting in 2012. With a 20-20 senate, it is still possible, though unlikely, that a court-drawn map could happen. I posted one on SSP about a year ago, but have made some tweaks since then.
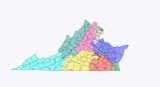
For each district below, the old statistics are in parentheses. All population statistics refer to VAP. Click on the thumbnails to expand the maps.
9th CD- Morgan Griffith (R)
Obama: 39.2% (39.7%)
Average D: 42.4% (43.4%)
White: 92.5% (92.5%)
Black: 03.6% (03.8%)
Hispanic: 01.5% (01.5%)
Asian: 01.4% (01.2%)
This seat changes very little. With the defeat of Rick Boucher in 2010, this seat is safely Republican.
6th CD- Bob Goodlatte (R)
Obama: 42.1% (41.6%)
Average D: 40.5% (40.4%)
White: 85.6% (83.3%)
Black: 08.0% (10.5%)
Hispanic: 04.1% (03.5%)
Asian: 01.1% (01.5%)
This is another seat with little change. It expands northward to take in the entire Shenandoah Valley, remaining safely Republican.
5th CD- Robert Hurt (R)
Obama: 41.8% (47.9%)
Average D: 41.1% (46.6%)
White: 71.3% (73.4%)
Black: 24.1% (21.3%)
Hispanic: 02.3% (02.5%)
Asian: 01.1% (01.6%)
The 5th remains based in Southside, but loses its more Democratic northern portions for southern Chesterfield County. It becomes significantly more Republican as a result, and Hurt will be safe here.
3rd CD- Open
Obama: 59.2% (74.1%)
Average D: 53.0% (69.0%)
White: 57.1% (39.8%)
Black: 31.1% (51.2%)
Hispanic: 05.6% (04.5%)
Asian: 04.4% (02.2%)
The district becomes a compact, metro Richmond seat. Though Eric Cantor lives in the district, he would never run here due to the Democratic lean of the district. A black Democrat is quite likely to win here, as the primary electorate is likely to be well over 50% black. Two potential candidates are Del. Jennifer McClellan and Sen. Donald McEachin.
4th CD- Bobby Scott (D)
Obama: 68.0% (49.7%)
Average D: 63.2% (46.3%)
White: 40.6% (59.7%)
Black: 52.4% (32.9%)
Hispanic: 03.4% (03.8%)
Asian: 01.7% (02.0%)
The 4th becomes a fairly compact, Hampton Roads-based VRA district. It is still safely Democratic for Bobby Scott.
2nd CD- Randy Forbes (R) v. Scott Rigell (R)
Obama: 47.2% (50.4%)
Average D: 45.3% (47.4%)
White: 68.7% (65.3%)
Black: 18.3% (20.9%)
Hispanic: 05.4% (06.0%)
Asian: 05.2% (05.3%)
The 2nd trades some of the more conservative precincts in the Hampton Roads area with the 4th to become a few points more conservative. Both Randy Forbes, formerly of the 4th, and Scott Rigell live here. Because the 4th is now safely Democratic, Forbes will probably like his odds better in a primary with Rigell. However, given that the district contains much more of Rigell’s turf, he has to be favored.
1st CD- Rob Wittman (R)
Obama: 44.7% (47.2%)
Average D: 42.6% (44.3%)
White: 72.6% (70.3%)
Black: 19.4% (19.0%)
Hispanic: 03.9% (05.7%)
Asian: 02.1% (02.8%)
This district remains similar, with the exception swapping out DC exurbs for Hanover County. That change makes the district a few points more Republican, so Wittman is safe here.
7th CD- Eric Cantor (R)
Obama: 53.0% (45.4%)
Average D: 47.7% (42.3%)
White: 59.0% (74.2%)
Black: 17.7% (16.4%)
Hispanic: 15.0% (04.1%)
Asian: 05.9% (03.8%)
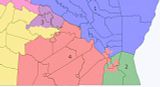
This is by far the most dramatically altered district, barely overlapping with the old 7th. It now contains Prince William, Stafford, and Spotsylvania Counties. Eric Cantor does not live here, but would probably run here. As stated above, he cannot win the new 3rd, where he lives. He would probably like to run in the 1st, as he currently represents the Republican bastion of Hanover County, but he would probably lose a primary to Rob Wittman. He might also like to run in the 10th, which is arguably more Republican and contains a fair number of his current turf around Culpepper. Unfortunately, Frank Wolf would likely run there, setting up another primary battle. By process of elimination, he would probably have to run here.
Cantor is not a terribly strong campaigner, having consistently underperformed in his current district. Additionally, almost all of the territory is new to him, negating the advantages of incumbency. Working in his favor, however, are the amount of cash he should be able to throw at the race and the lack of a Democratic bench. Overall, I’d rate this as a toss-up
10th CD- Frank Wolf (R)
Obama: 51.7% (51.9%)
Average D: 47.9% (47.4%)
White: 73.1% (66.2%)
Black: 10.4% (07.2%)
Hispanic: 07.2% (12.2%)
Asian: 07.4% (12.3%)
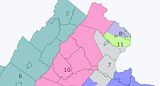
This district retains its Loudoun County core but sheds everything else for the counties of the Piedmont, including Albemarle and the City of Charlottesville. On balance, the partisan makeup of the district does not change. Wolf doesn’t live in the district, but has represented Loudoun for 30 years and would likely run here. Ostensibly this district should be a toss-up, but because of Wolf’s incumbency and the lack of a Democratic bench he should be favored.
11th CD- Gerry Connolly (D)
Obama: 60.7% (56.0%)
Average D: 56.8% (52.0%)
White: 55.6% (57.4%)
Black: 12.7% (10.8%)
Hispanic: 14.4% (14.1%)
Asian: 14.9% (15.2%)
This district becomes more Democratic, losing its Prince William precincts and gaining the City of Alexandria. Connolly lives just outside the district in the 8th, but has represented most of it in Congress or on the Board of Supervisors. Because Moran also lives in the 8th, Connolly would likely run here. HE should have no problems with the increased Democratic performance.
8th CD- Jim Moran (D)
Obama: 62.7% (68.0%)
Average D: 60.6% (65.9%)
White: 61.3% (57.2%)
Black: 06.6% (12.8%)
Hispanic: 14.4% (16.8%)
Asian: 15.4% (10.8%)
The district loses the City of Alexandria and some other close-in precincts to take in northern Fairfax County. It becomes significantly less Democratic, but still safe. Jim Moran, who now lives in Arlington, would likely run here. He’d have no problems in the general election.
In conclusion, I’d rate this map as 4D-5R-2. In 2012, it would probably result in a 5D-6R delegation for a net of +2D
