Well, here is something I almost never do these days. A political race related diary. And of course, leave it to me to decide to tackle a giant redistricting project after all redistricting has been completed, (with the exception of Kansas).
But what I wanted to do was show the effect of having bipartisan public committees handle redistricting efforts, with criteria of compactness, regional interests, and party-balance, with an emphasis on creating politically competitive districts where possible.
For this I chose to tackle the states that Republicans pushed the most egregious gerrymanders, states where they mangled the rights of voters, packed Democrats, split counties with impunity, and hashed districts together with no regard for community of interests.
To start, (I have others, but doing PA, TX, OH, NC and GA all in one diary is far too much work), I did Pennsylvania, and actually this map turned out better than any of my others, perhaps because I've drawn it so many other times, failed in some regards, but gained a good knowledge of the state's politics.
To start, let's look at the map Republicans are using:
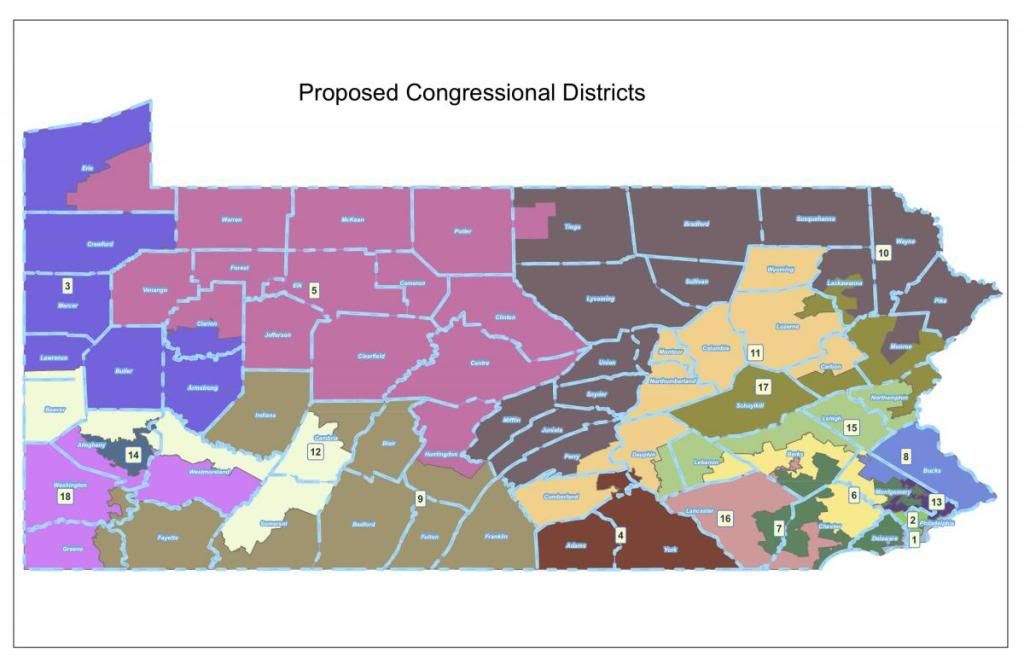
This is an egregious map which essentially relegates Democrats to just 5 of 18 seats in the long term, (I don't believe Critz can hold on to his current district in the long-run, the way it is trending and the way they snuck in larger parts of pretty Republican areas). It's a nasty map, one of the ugliest, though not as ugly as the Republican map in Texas.
I will start with the 18th district, and work my way from there, since I am a contrarian.
PA-18 (Yellow):
Voting Age Population:
81.5% White
12.3% Black
1.5% Hispanic
3.4% Asian
President 2008:
Obama 60.8%
Average Democratic Vote:
62.9%
This district is essentially Mike Doyle's, even though his home of Forest Hills lies a little outside of it. The Upper St. Clair home of Rep Tim Murphy (who looks suspiciously like Grand Moff Tarkin), is also in this district, which essentially takes in all of southwestern and central Allegheny county, including all of Pittsburgh proper. It's a heavily Democratic district that should remain that way despite the growth and reddening of some of these southern end suburbs. Murphy would not run here.
Pros and Cons: On one hand, it is neatly compact, and doesn't purposefully zip around to create a 70% Obama district as the Republican's map does. I don't believe there was even much splitting of local municipalities, and Pittsburgh retains a seat to represent it's direct urban interests in Congress. But on the other, it probably will trend against Democrats, not enough to make a difference probably. I know the ritzy places like Upper St. Clair really don't go together with blue collar, Democratic Pittsburgh, but the only other option was to make a more awkward, amoeba of a district that packed Democratic voters unfairly, and left another Allegheny district shaped like a loop and practically a gerrymander for Republicans, and which would also not be perfect for communities of interest because it would tie blue collar suburbs together with wealthy white collar ones. In the end, drawing from the perspective of a Bipartisan commission with the aforementioned goals, this was the best option of what I tried.
PA-17 (Dark Slate Blue):
Voting Age Population:
87.7% White
8.8% Black
1% Hispanic
1.6% Asian
President 2008:
Obama: 50.0%
Average Democratic Vote:
53.8%
This is Jason Altmire's district. He lives in McCandless, a north Allegheny community, and most of his business and public career focused on this area. He's not even from Beaver County, which is why it confused when he was occasionally described as a Beaver County congressman. This area is also trending Republican, though perhaps not as fast as some other areas. Despite this, they have a stronger base of local organization and officials in many parts of this district than they do in other, more rural parts of SW PA.
Pros and Cons: Allegheny County is no longer split between 4 congressional districts. It now has one urban, Pittsburgh district, and one more blue collar, suburban district, with some close-in blue collar suburban communities of Westmoreland county to supply the rest of the population, so here we have a compact district to serve a certain group of voters. It's also a very swing district that Obama won by 3000 votes and would probably lose by at least 4 points this time around. In the long-run, this district probably wouldn't remain in Democratic hands, but Jason Altmire would actually be a pretty good fit for it and could hold it for the decade barring another wave election.
PA-16 (Lime Green):
Voting Age Population:
94.3% White
3.6% Black
.8% Hispanic
.5% Asian
2008 President:
Obama: 46.2%
Average Democratic Vote:
52.6%
Technically no incumbent here. Tim Murphy would probably run in this district though, (and Mark Critz might as well, though he performed very poorly in the Green and Washington portions of his district in 2010, despite both being the most Democratic sections of those counties).
Pros and Cons: Obama would be lucky to get 45% in 2012 in this district, which would certainly hamper any Democrat. However, locally it still leans Democratic, and this is one area that is so ancestrally Democratic that Republicans have little local base or presence outside of some more exurban portions of Beaver and Washington counties. The combination of a deeper bench, a strong local Democrat, and the better organized local Democratic party, would make this a very competitive seat. It's a toss up swing district, though also one rapidly trending away from the Democrats in a way PA-18 and PA-17 aren't, so any success would likely be short-lived unless trends changed. Most importantly, it's a beautifully compact district that serves to represent the outer Pittsburgh suburbs and the rural coal and mining counties.
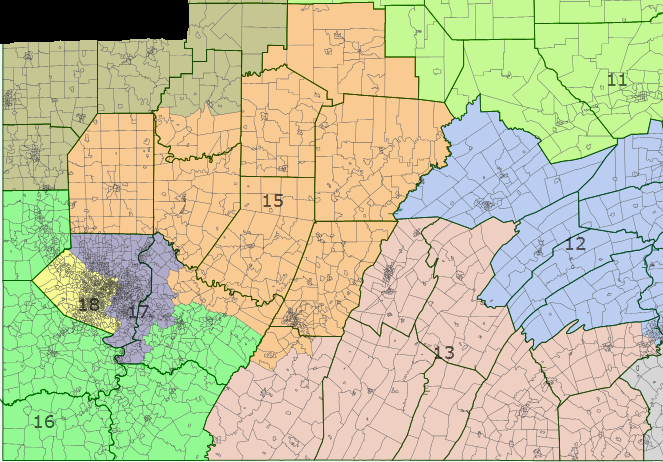
PA-15 (Dark Orange):
Voting Age Population:
96% White
1.8% Black
1.0% Hispanic
.6% Asian
2008 President:
Obama: 41.6%
Average Democratic Vote:
45.5%
Well, one result of this map was that Mark Critz was screwed more thoroughly than Republicans screwed him. Funny how my criteria ended up doing that. Mike Kelly actually also lives in this district, in Butler County (and has more ties to the Pittsburgh area than to Erie), and would probably run in this district as well.
Pros and Cons: And one reason why is that Johnstown and Cambria county are sort of their own little thing; they aren't legitimately part of the Pittsburgh sphere of influence. And, as SW has lost population, once I finished the three primary districts in that area, arranging according to compactness and local communities, Critz's district was pushed further out. It takes in a lot of exurban territory like Armstrong, Jefferson and Butler, which never vote for Democrats, some tough but winnable counties like Clearfield and Indiana. This district looks a bit more like Murtha's district originally looked in the 1970s, with Cambria joined together with a large swath of rural and suburban territory in central western PA. It's trending against Democrats, and is already Republican. Critz could probably make it a close race by say, winning Cambria with 59% of the vote, and perhaps pulling off a decent sized margin in Indiana county, and maybe holding down the Republican margins to around 60% in the aforementioned Republican areas, but I just don't see him managing to win this. It would take a Jim Matheson-Chet Edwards-Tim Holden style upset and campaign to pull it off. For all purposes it is a Republican leaning seat.
PA-14 (Olive Brown):
Voting Age Population:
92.6% White
4.2% Black
1.5% Hispanic
.7% Asian
President 2008:
51.1% Obama
Average Democratic Vote:
49.8%
As I mentioned earlier, this would probably be an open seat, as I see Rep Mike Kelly bolting to the much friendlier 15th, which has his home and some of the areas he depended on to win in 2010. Really, he doesn't have much business running in an Erie County based district anyway.
Pros and Cons: Not many. I'd say this is a consummate swing district, as it has traditionally been. It's compact and splits one county, and represents it's region pretty neatly. It filled all my checklists; a competitive, compact, regionally based district. Who might win is anyone's guess.
PA-13 (Salmon Pink):
Voting Age Population:
93.7% White
2.3% Black
2.2% Hispanic
.9% Asian
2008 President:
Obama: 36.4%
Average Democratic Vote:
35.9%
Welcome to Little Alabama, Pennsylvania. This is the home of Rep. Bill Shuster, and it's a swath of the most ironclad Republican vote anywhere in the state, making it the most rock-ribbed Republican district. Very socially conservative, very fiscally conservative, and very rural nothing to see.
Pros and Cons: Nothing really. This is closer to the 2002 version of the district, as this time around Republicans contorted it to pack away Democratic votes from SW PA. As it is now it is a compact, south-central PA district. In Cumberland county I left the immediate suburbs of Harrisburg out of it so that they could be united in one district of general interests.

PA-12 (Cornflower Blue)
Voting Age Population:
84.6% White
7.6% Black
3.6% Hispanic
3.1% Asian
2008 President:
Obama: 48.4%
Average Democratic Vote:
45.0%
Here is Glenn Thompson's district. Haven't heard of him? Probably because he's among the biggest backbenchers of the PA delegation, and won an open Republican seat in 2008 that no one even paid attention to with 57% of the vote. He's a former Chairman of the Centre County Republican Party.
Pros and Cons: Another, at least going by the toplines, competitive swing district; one of my goals was a commission that was bound to create competitive districts where possible. The area still leans Republican on a local area, and contains some deeply conservative areas. However, Dauphin and Centre counties would both appear to be trending Democratic with time, and Obama will probably match his 2008 percentage here in 2012. This district appealed to me, as it contained the very center of the state, didn't split counties unnecessarily, and serves as a relatively compact amalgamation of urban and suburban territory in Central PA.
PA-11 (Chartreuse):
Voting Age Population:
94.1% White
2.0% Black
2.6% Hispanic
.6% Asian
2008 President:
Obama: 42.0%
Average Democratic Vote:
41.0%
Little to see here. This is Tom Marino's district. It was already sprawling, and now it sprawls a little more. It's very Republican and not competitive for Democrats. Rep Lou Barletta's base and home of Hazelton is also in this district. Given Marino's numerous ethics problems, and Barletta's sort of "giant-killer/rising star" status in the PA Republican party (I guess the third time sometimes is the charm), I expect Republicans would back him here.
Pros and Cons: This district actually serves pretty well to take in all the rural areas of north PA in one district, that ends on the edge of Northeast PA. It definitely obeys community interests, and it slips out of reach for Democrats with these changes, giving Republicans their 3rd "definitively favored" seat in the state.
PA-10 (Pink):
Voting Age Population:
87.5% White
4.6% Black
5.6% Hispanic
1.4% Asian
2008 President:
Obama: 57.4%
Average Democratic Vote:
55.6%
With Kanjorski gone and Barletta in the very tempting 11th, I expect that this would be an open seat, and one that definitively leans Democratic.
Pros and Cons: This is a compact seat. It takes in most all of Northeast PA, and keeps the Scranton region together in one seat, alongside Wilkes-Barre and more conservative, rural areas.
PA-09 (Cyan):
Voting Age Population:
81.4% White
3.9% Black
11.2% Hispanic
2.4% Asian
2008 President:
Obama: 55.7%
Average Democratic Vote:
53.9%
This is Charlie Dent's district, and given how easily he's held it up until now, I doubt anything will change, and it became slightly more Republican under this plan.
Pros and Cons: Lehigh Valley isn't carved up like a Thanksgiving Turkey. The district is compact and competitive. I would say this map is even favorable to Dent. Democrats have struggled to put this area in play, and it still frequently backs Republicans, and though trending Democratic, I would still define it as a swing district. Relatively uncontroversial.
PA-08 (Grayish-Purple):
Voting Age Population:
85.8% White
3.1% Black
9.3% Hispanic
1.0% Asian
2008 President:
Obama: 49.4%
Average Democratic Vote:
47.2%
This is Tim Holden's district.
Pros and Cons: Well, this looks more like I believe his district looked like in the 1990s, Schuykill County connected to Reading and the rural-suburban space between. The nature of this district sitting in between so many other distinct regions meant that it was always going to be a bit of a Frankenstein. Obama won it by 900 votes, and Democrats normally fall 16,000 votes short. It's a swing district, measuring well on my parameters in this regard, but most likely Holden would have dominated this district for as long as he wanted to. And over time, Reading's growth and Democratic trend would have probably pushed this district into the leans Democratic category even without Holden.
PA-07 (Gray):
Voting Age Population:
85.6% White
4.6% Black
7.0% Hispanic
1.6% Asian
2008 President:
Obama: 45.9%
Average Democratic Vote:
40.6%
This seat is currently open since Rep. Todd Platts is retiring.
Pros and Cons: Well, there weren't a whole lot of options with this district. I chose to balance out Pitts district by having the 7th take in heavily Democratic portions of the city of Lancaster, which has seen a lot of minority growth. The 7th is still Republican territory, and Democrats are 15-20 years away from having the local base and organization to seriously compete for this district.
PA-06 (Teal):
Voting Age Population:
87.4% White
4.3% Black
4.6% Hispanic
2.9% Asian
2008 President:
Obama: 48.2%
Average Democratic Vote:
43.1%
This is Rep Joe Pitts district. Jim Gerlach also lives here, but probably wouldn't run here.
Pros and Cons: Well, the Amish aren't going to fit in any district that is now apart of the Philadelphia exurban sprawl. However they do keep it Republican leaning. The district is compact, and contains almost all of Chester County except for one, the unfortunate little slice on the northern end that Holden's district needed for population, and the even more unfortunate and annoying small community of Phoenixville, which didn't fit and therefore went into the 5th. It's a swing district, and probably one that will end up in Democratic hands eventually. Probably not in 2012 or 2014, but those should be crucial years of laying the foundations for ousting Pitts or whomever Republicans nominate to succeed him when he retires.
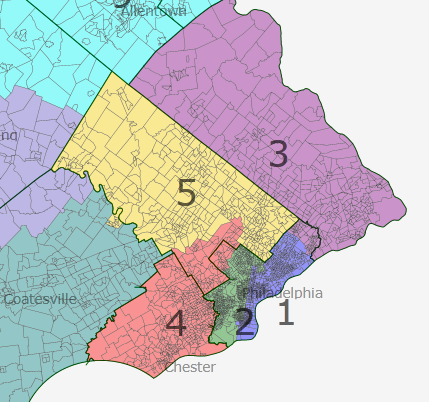
PA-05 (Gold):
Voting Age Population:
80.2% White
8.4% Black
4.0% Hispanic
6.4% Asian
2008 President:
Obama: 58.7%
Average Democratic Vote:
54.7%
Rep Allyson Schwarz's Jenkintown home is in this district. This is also the district where Rep Gerlach would probably run, though he has few options.
Pros and Cons: Well, by actually concentrating districts into the Philly suburbs, a district was actually lost, with Gerlach's essentially combining with Schwarz's to form something Republicans have gone to ridiculous lengths to stop; a Montgomery County district. That was pretty important to me, and the area has trended Democratic. Allyson Schwarz is a strong campaigner and fundraiser, and Gerlach has normally had poor performances in MontCo; he won by running up ridiculous margins in the Chester and Berks portions of the district. Definitely a Democratic district, and trending moreso. Technically a one seat gain for Democrats.
PA-04 (Red):
Voting Age Population
76.4% White
15.4% Black
2.5% Hispanic
4.5% Asian
2008 President:
Obama: 62.0%
Average Democratic Vote:
59.0%
It was remarkable what this district turned into when it was simply ungerrymandered.
Pros and Cons: It becomes the most Democratic of any of the three, solely suburban Philly districts. Pat Meehan might as well start packing, because even in 2010 he would have probably come up short in this district by 6-8 percentage points. The district takes in all of Delaware County, and parts of southern MontCo and North Philadelphia. Still a huge difference from the five county sprawl that ties a city like Chester and some near in blue collar Philly suburbs, to Lancaster and Berks counties as the Republicans did. In this respect, this is an all but certain pick up for Democrats.
PA-03 (Purple):
Voting Age population:
87.8% White
3.5% Black
3.7% Hispanic
4.0% Asian
2008 President:
Obama: 53.7%
Average Democratic Vote:
52.5%
Rep Mike Fitzpatrick's district.
Pros and Cons: Well, this district almost see no change. Bucks County is nearly large enough to have it's own district. The rest of the population comes from Northwest Philadelphia, but if anything, I believe this district ended up moving half a percentage point to the right. And, unlike Delaware and Montgomery, Bucks County is more blue collar and traditionally was the most Republican of the three suburban counties, as such, Obama did not over-perform there as much as the other districts. There wasn't much swing here over the decade, especially compared to Delaware and Montgomery counties. This is another swing district, and one Fitzpatrick might be able to hold on to if he doesn't continue to vote lockstep with the national party's obstructionist agenda.
PA-02 (Green):
Voting Age Population:
23.4% White
64.9% Black
3.8% Hispanic
5.7% Asian
2008 President:
Obama: 94.2%
Average Democratic Vote:
92.4%
Rep. Chaka Fattah's district.
Pros and Cons: Nothing to discuss here. I just ended up splitting Philly along East and West sides, and the west side created Fattah's mostly black district. One of the most heavily Democratic districts in the country.
PA-01 (Blue):
Voting Age Population:
52.3% White
19.8% Black
18.5% Hispanic
7.5% Asian
2008 President:
Obama: 73.5%
Average Democratic Vote:
75.1%
Rep Bob Brady's district.
Pros and Cons: Again nothing to see. A minority Democrat will probably pick this seat up once Brady retires. Oddly enough the more heavily minority 2nd had significantly higher turnout.
Anyway, that was rather exhausting. Hopefully I will get to Texas next week. But, for those of of you who weren't counting, the breakdown of the state falls like this:
Democratic Seats: 6
Republican Seats: 4
Swing Seats: 8
Split the swing districts down the middle, and you get a 10-8 Congressional delegation, which actually nearly matches Obama's percentage last time. And, this map is so good (let me brag on myself please), that the two districts that Democrats will lose in the southwest, will be replaced by the fact they'll gain the 6th in the future, and have strong shots at PA-12 and PA-03.
P.S. While Dkos does have reader guages, these aren't entirely accurate. I always appreciate users who vote in my poll as that gives a more accurate count of readership. Which is always nice to know for something you worked hard on; sucks to feel like you are talking to a wall.

