Well, here is something I almost never do these days. A political race related diary. And of course, leave it to me to decide to tackle a giant redistricting project after all redistricting has been completed, (with the exception of Kansas).
But what I wanted to do was show the effect of having bipartisan public committees handle redistricting efforts, with criteria of compactness, regional interests, and party-balance, with an emphasis on creating politically competitive districts where possible.
For this I chose to tackle the states that Republicans pushed the most egregious gerrymanders, states where they mangled the rights of voters, packed Democrats, split counties with impunity, and hashed districts together with no regard for community of interests.
This is the second installment, the massive unwieldy, and annoying Texas-sized version I have put off for several weeks now, and even now only time to do the first installment (I'll get to the second this weekend or next week). Texas is not only huge, but it's got so much variation that it was difficult to be as loyal to the communities of interest portion of the issue, and in some areas, it turned into a Republican gerrymander, (keeping some things that state Republicans would love), while in others it really does some harm. In the end, the polarization meant I couldn't pack nearly as many swing districts as in Pennsylvania, but I think I've created a map that's more balanced for both parties and represents their political strength in the state well.
To start, let's go to the panhandle where I cleaned up the silly looking lines a bit:
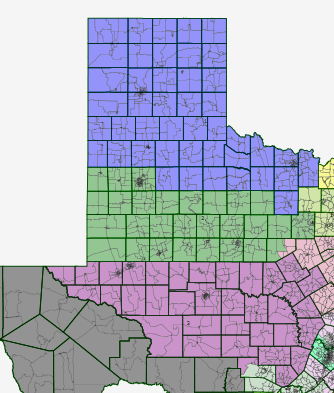
TX-01 (Blue):
2008 Presidential Results:
23.2% Obama, 76.8% McCain
Average Partisan Results:
27% Democratic
73% Republican
Voting Age Demographics:
66.7% White
5.4% Black
24.7% Hispanic
1.6% Asian
District Summary:
It's hard to believe that Bill Sarpalius won election to this district in 1988, and was reelected in 1990 and 1992 before losing 55-45 in 1994, (even a ten point spread in this district seems unfathomable in fact). Well, Sarpalius is a lobbyist in Washington, and Mac Thornberry is 53, a nine-term incumbent, and not going anywhere anytime soon. Romney will likely get 80% in this Panhandle, Amarillo-Wichita Falls district.
TX-02 (Green):
2008 Presidential Results:
27.6% Obama, 72.4% McCain
Average Partisan Results:
29.8% Democratic
70.2% Republican
Voting Age Demographics:
64.7% White
5.8% Black
26.8% Hispanic
1.4% Asian
District Summary:
Even harder to believe that a large portion of the territory in this district was represented by Charlie Stenholm as recently as 2004, or that Stenholm managed to come within eighteen percentage points in the Delay-created monstrosity designed to get rid of him (he might have somehow held onto until 2010 otherwise). This Lubbock-Abilene district is safe for Randy Neugebauer, who famously jeered Bart Stupak on the House Floor in 2010, calling him a "Baby-Killer!", while he was discussing some amendments with other Republicans. I can understand why Stupak got so fed up and disgusted with everyone that the threw in the towel and retired.
TX-03 (Purple):
2008 Presidential Results:
24.0% Obama, 76% McCain
Average Partisan Results:
26% Democratic
74% Republican
Voting Age Demographics:
64.9% White
3.2% Black
29.8% Hispanic
District Summary:
My understanding is that this area of Texas has been more historically conservative than either the 1st or 2nd. This is a Midland-Odessa-San Angelo based district. West Texas has three districts now, including this one, but I expect that by 2020 they'll have to be compacted into 2, given population losses and the need to gain population without sprawling into the Dallas-Forth Worth suburbs.
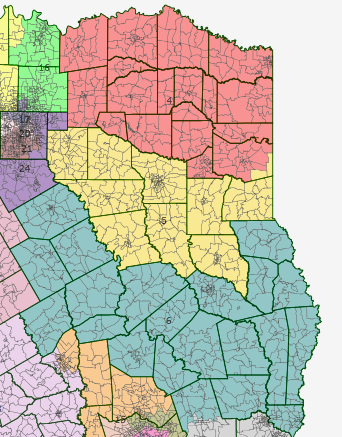
Now over to East Texas, where there are another trio of rural, extremely conservative districts for Republicans, and where I also tried to clean up the lines a bit, and reduce county splitting, while pushing several districts away from the Dallas-Forth Worth exurbs.
TX-04 (Red):
2008 Presidential Results:
30.1% Obama, 69.9% McCain
Average Partisan Results:
37.5% Democratic
62.5% Republican
Voting Age Demographics:
74.0% White
14.2% Black
9.4% Hispanic
District Summary
This is Ralph Hall's district, minus his home and political base, the tiny Rockwall County. I was trying to limit the influence of exurban DFW on what I view as a rural northeastern Texas district. In this area you can actually kind of see the slide away from Democrats. I can actually see how Texas Democratic Party was quite strong here legislatively until 2004, and I can also see how their statewide strength has quickly bottomed out here (but still nowhere near as fast as Federal numbers have). Ralph Hall is actually much better than what I expect we'd normally get here, even if he was the most conservative Democrat in the House before and after 1994, so conservative, and so friendly with Republicans, that he wasn't even targeted by DeLay. Let's hope he stays around in this Paris-Longview-Texarkana district for a few more terms. Interesting fact: since the 1912 elections, this district has had 3 U.S. Representatives. I'm sure that fact drives the CPA folks crazy with fury.
TX-05 (Yellow):
2008 Presidential Results:
29.2% Obama, 70.8% McCain
Average Partisan Results:
32.4% Democratic
67.6% Republican
Voting Age Demographics:
71.3% White
14.1% Black
12.4% Hispanic
District Summary:
Well, going by first impressions, Louie Gohmert is creepy. I mean that from his congressional photo: http://en.wikipedia.org/... But, when he's not out talking about Terror Babies, putting forth legislation questioning Obama's citizenship, or promoting pipeline projects in Alaska because they help caribou have more sex, he's getting reelected in this strongly Republican district. Max Sandlin got crushed in somewhat similar territory back in 2004.
TX-06 (Teal):
2008 Presidential Results:
29.6% Obama, 70.4% McCain
Average Partisan Results:
39.3% Democratic
60.7% Republican
Voting Age Demographics:
73.5% White
13.8% Black
10.9% Hispanic
District Summary
This is a new district, strangely enough, or as closely as I can figure it is. The collapse of the Democratic brand in East Texas is really, really visible here, and I can easily see Max Sandlin having gotten reelected here in 2004 and 2006 at least, had he had an option to run in a district like this. As it is, the DeLay gerrymander of East Texas, is, like the gerrymander of the Panhandle and West Texas, no longer necessary.
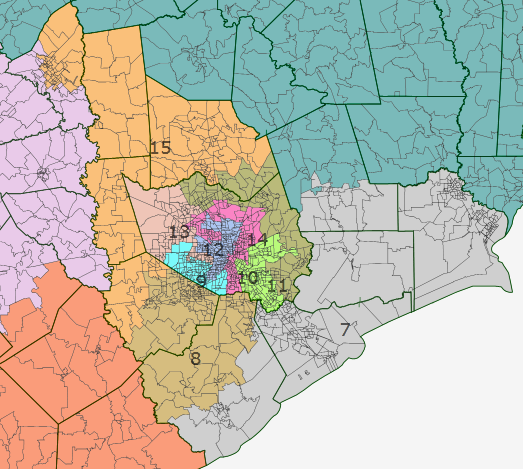
TX-07 (Gray):
2008 Presidential Results:
41.9% Obama, 58.1% McCain
Average Partisan Results:
45.8% Democratic
54.2% Republican
Voting Age Demographics:
58.2% White
19.1% Black
18.6% Hispanic
2.7% Asian
District Summary:
If the trends in Jefferson and Galveston counties weren't so bad from wealthy white suburbanization, I'd almost say this reconfiguration of Ron Paul's district would have given Nick Lampson a chance in 2012 elections. As it is I think this district is an area well on the way to becoming Republican strongholds.
TX-08 (Dark Goldenrod):
2008 Presidential Results:
47.6% Obama, 52.6% McCain
Average Partisan Results:
43.9% Democratic
56.1% Republican
Voting Age Demographics:
41.2% White
20.1% Black
22.5% Hispanic
14.5% Asian
District Summary:
Here is a new district, created out of the bulk of Fort Bend county, and northern Brazoria County. A prime pick up opportunity for Democrats, due to explosive minority growth. I'd be willing to make a substantial bet that Obama wins this district by at least +2 this year, maybe more if he made an effort to gear up voter registration and GOTV efforts in the Houston area. An extremely competitive house race in what is, for the moment, a swing district.
TX-09 (Cyan):
2008 Presidential Results:
63.7% Obama, 36.3% McCain
Average Partisan Results:
57.4% Democratic
42.6% Republican
Voting Age Demographics:
21.6% White
25.1% Black
38.7% Hispanic
13.0% Asian
District Summary:
This is Al Green's district. A little less black, a little more Republican, but on the whole a safe Democratic district, and perhaps one of the most diverse in the country. I doubt he would have any issues with it in the General or in the Primary elections.
TX-10 (Dark Pink):
2008 Presidential Results:
78.8% Obama, 22.2% McCain
Average Partisan Results:
74.8% Democratic
25.2% Republican
Voting Age Demographics:
17.9% White
45.6% Black
30.8% Hispanic
4.4% Asian
District Summary:
I couldn't quite finagle a majority black district out of the remaining Houston areas, but the district remains safely Democratic, and the large Black population should be enough to ensure that the community has congressional representation. Shelia Jackson-Lee though, probably still needs to go, she might be even worse than Laura Richardson.
TX-11 (Chartreuse):
2008 Presidential Results:
50.7% Obama, 49.3% McCain
Average Partisan Results:
50.5% Democratic
49.5% Republican
Voting Age Demographics:
28.0% White
9.7% Black
56.7% Hispanic
4.7% Asian
District Summary:
Yeah, this district is pretty much the case in point when discussing why Obama should invest in helping the Texas Democratic party gets it stuff together, and the need for a massive voter registration effort and the creation of a Harris County GOTV machine; one Texan Democrat estimated from studying the counties demographics, that Democrats could get an additionally 500,000 votes if they could get their turnout and participation up to acceptable levels. This is, for all intents and purposes, Pete Olson's Pasadena-based district, though I don't think he could win it in this iteration. Another toss-up district that I managed to create.
TX-12 (Cornflower Blue):
2008 Presidential Election Results:
54.7% Obama, 45.3% McCain
Average Partisan Results:
51.9% Democratic
48.1% Republican
Voting Age Demographics:
38.6% White
9.2% Black
46.1% Hispanic
5.0% Asian
District Summary:
Another reason why Democrats need to amass a party organizational machine in Harris County. This district however, at least, still leans Democratic and is trending more along those lines. Gene Green, (not to be confused with his colleague Al), has been around a while, and is uncontroversial, a bit more on the moderate side of things, and shouldn't really have issues here.
TX-13 (Salmon):
2008 Presidential Results:
33.3% Obama, 66.7% McCain
Average Partisan Results:
27.2% Democratic
72.8% Republican
Voting Age Demographics:
55.7% White
9.3% Black
24.9% Hispanic
8.6% Asian
District Summary:
John Culberson, however many other Republicans would have found this map annoying, gets the district of his dreams. However, even this district is trending Democratic, and I'd predict a +4 gain for Obama here in 2012. It's Republican enough though, and with a solid enough baseline, to be safe for the next decade, and probably beyond.
TX-14 (Olive Brown):
2008 Presidential Results:
30.4% Obama, 69.6% McCain
Average Partisan Results:
27.6% Democratic
72.4% Republican
Voting Age Demographics:
64.6% White
9.2% Black
21.1% Hispanic
3.7% Asian
District Summary:
Ted Poe can hold this district until he is Ralph Hall's age. I don't see it getting competitive for Democrats before then.
TX-15 (Dark Orange):
2008 Presidential Results:
29% Obama, 71% McCain
Average Partisan Results:
26.2% Democratic
73.8% Republican
Voting Age Demographics:
67.4% White
8.1% Black
18.7% Hispanic
4.5% Asian
District summary:
I can't even bring myself to waste too much space on this district. It looks ugly. Kevin Brady's district is pushed out along the very outermost exurbs and some rural territory. It takes almost all of Bryan and College Station (would have had all of it if I could have split precincts). This is nothing that Republicans aren't doing already, well, I mean with tying Mike McCaul into the Houston suburbs.
P.S. While Dkos does have reader guages, these aren't entirely accurate. I always appreciate users who vote in my poll as that gives a more accurate count of readership. Which is always nice to know for something you worked hard on; sucks to feel like you are talking to a wall.

