This is the second installment, after this first one:
Part One
Yeah, I said some hilarious things there, like, "I'll try to get back and finish this next week." What a riot. But the concept is still very important. The proportional body of Congress, the House, is brutally gerrymandered throughout the country. I wanted to look at some states where possible independent maps could have major ramifications on the composition of the body and the power status in America.
What I want to do with this series is to show the effect of having bipartisan public committees handle redistricting efforts, with criteria of compactness, regional interests, and party-balance, with an emphasis on creating politically competitive districts where possible.
For this I chose to tackle the states that Republicans pushed the most egregious gerrymanders, states where they mangled the rights of voters, packed Democrats, split counties with impunity, and hashed districts together with no regard for community of interests.
I have already done Pennsylvania in it's entirety, and very well I might add. Texas is a much trickier state, and larger, and so, without further ado, here is my second part, which begins with District 16.
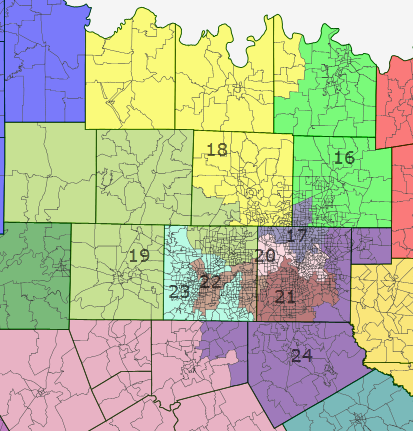
TX-16 (Lime Green):
2008 Presidential Results:
Obama 35.2%, McCain 64.8
Average Partisan Results:
28.9% Democratic
71.1% Republican
Voting Age Demographics:
69.2% White
7.6% Black
13.7% Hispanic
7.3% Asian
District Summary:
I'm incline to call this Representative Sam Johnson's district, even though his Plano home is not within it. It contains most all of Collin and Grayson Counties. Collin is diversifying pretty steadily, and the Dallas area seems to be moving quickly towards Democrats. However this outer ring is still brutal for the D-Team, and several decades away from even being in contention, and that's assuming minority growth and the like don't trail off in here in the next few years. Rep. Johnson is 81, a quiet backbencher, and a Conservatives Conservative.
TX-17 (Dark Slate Blue, whatever that is):
2008 Presidential Results:
Obama 41%, McCain 59%
Average Partisan Results:
32.6% Democratic
67.4% Republican
Voting Age Demographics:
60.0% White
9.2% Black
18.2% Hispanic
10.9% Asian
District Summary:
Rep. Jeb Hensarling's district, or that is the intention. I didn't approach these maps with an idea of being beholden to the old districts or their Congressperson's base of support. This also contains most of Plano. I'd say with two or three Presidential cycles a centrist to conservative, business Democrat could compete here on a Congressional level, but even then it would still be an uphill battle since local baselines change much slower that Federal ones.
TX-18 (Yellow):
2008 Presidential Results:
36.5% Obama, 63.5% McCain
Average Partisan Results:
30.6% Democratic
69.4% Republican
Voting Age Demographics:
68.8% White
7.6% Black
15.4% Hispanic
6.1% Asian
District Summary:
This district contains almost all of Denton County, along with more rural-exurban areas like Montague County, (thankfully there is no Capulet County in the district as well), Cooke County, and part of Grayson County. I think most people's familiarity with Denton comes from The Mountain Goats:
(I'm in a very humorous mood today). In any case, I think despite the fast rate which the city of Denton itself is becoming diverse and more political moderate, the rest of Denton county is some rock-ribbed suburbanite Texas Republican wonderland, and the rural are overwhelmingly conservative as well. I don't see this area moving in reach of Democrats. The best that might happen is that Denton may eventually give Democrats a State House seat, it it were not split between two districts or something.
TX-19 (Light Vomit Green):
2008 Presidential Results:
29.8% Obama, 70.2% McCain
Average Partisan Results:
26.8% Democratic
73.2% Republican
Voting Age Demographics:
77.5% White
4.3% Black
12.4% Hispanic
4.1% Asian
District Summary:
This district really doesn't belong to anyone, but my thought was that Kenny Marchant would like run here, even though his home in Coppell is in Dallas County, in TX-17. His current 24th shares very little territory with this district, but he has a better position to run in it than anyone else, and would probably not be opposed in a primary. It's solidly Republican and not going anywhere obviously. Growth in this district is more exurban, white, and conservative.
TX-20 (Flesh Pink):
2008 Presidential Results:
60.2% Obama, 39.8% McCain
Average Partisan Results:
54.3% Democratic
45.7% Republican
Voting Age Demographics:
37.7% White
16.6% Black
37.5% Hispanic
6.6% Asian
District Summary:
This was one of the pleasant surprises I found when tackling the DFW area. I tackled in two ways, first drawing the plurality AA district of Rep Eddie Bernice Johnson, then drawing a new, heavily minority TX-22. Then I worked my way outward in a loop. Surprisingly, trying to consolidate other Republican areas and keep Dallas County less mishmashed, had the unexpected effect of screwing Rep. Pete Sessions, NRCC Chairman and National Republican leader, out of his district, even though that wasn't something I intentionally tried to do. Coming back to it, I saw that it was something that should be expected out of any independent map; Tarrant And Dallas Counties have a huge number of Democratic voters, and a fair map should easily give them 3 districts in the area, not the two super-loaded districts as the Republicans have, with other Democratic areas split apart into 4-5 extremely conservative, suburban-based districts in order to maintain the Republican hegemony in the area at a Federal level. This north-central Dallas County district is one of the most diverse in the state and is very Democratic and getting more than way every cycle. A conservative like Sessions has no chance here.
TX-21 (Maroon):
2008 Presidential Results:
78.6% Obama, 21.4% McCain
Average Partisan Results:
74.4% Democratic
25.6% Republican
Voting Age Demographics:
18.2% White
40.7% Black
38.6% Hispanic
1.4% Asian
District Summary:
I might have been born in this district, I'm not sure though. Other than that illustrious bit of American history, there is very little to say about this district politically. Overwhelmingly minority, and solidly Democratic. Turnout isn't always very good here. A better statewide GOTV apparatus is sorely needed in the Texas-DP, which is in sore need of refurbishing and modernization.
TX-22 (Light Brown):
2008 Presidential Results:
66.5% Obama, 33.5% McCain
Average Partisan Results:
61.8% Democratic
38.2% Republican
Voting Age Demographics:
28.7% White
25.9% Black
38.4% Hispanic
5.5% Asian
District Summary:
Even Republicans knew they had no choice but to grudgingly draw one more Democratic vote sink the DFW area. This is for the most pretty similar to what they drew. State Rep. Marc Veasey would be the favorite in the primary either way, and a shoe-in for the General.
TX-23 (Aquamarine):
2008 Presidential Results:
37.7% Obama, 62.3% McCain
Average Partisan Results:
34% Democratic
66% Republican
Voting Age Demographics:
68.4% White
8.4% Black
17.8% Hispanic
3.7% Asian
District Summary:
This is Rep. Kay Granger's district. It remains rock-ribbed Republican, taking in most of the whiter, wealthier, suburban areas of Tarrant County. But it does take in sizeable portions of Arlington and Fort Worth. If Tarrant County as a whole shifted to being , say, a reliable 55-45 Democratic county, as I think is likely to happen over the next ten to twelve years, then this district is probably going to become competitive alongside said trend.
TX-24 (Purple):
2008 Presidential Results:
37.1% Obama, 62.9% McCain
Average Partisan Results:
33.8% Democratic
66.2% Republican
Voting Age Demographics:
59.6% White
11.5% Black
23.4% Hispanic
3.9% Asian
District Summary:
I think Joe Barton would also be one Republican a little more pleased by how this map came out, as opposed to the one he got, where he had to be a team player and take on a lot more Democratic-leaning and trending areas. Some of the Dallas County portions of this district, like Mesquite, are swingish, but it also contains some of the most Republican parts of the county as well, along with rock-solid Republican counties like Rockwall and Ellis.
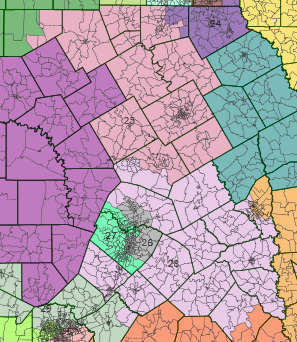
TX-25 (Pale Violet Red):
2008 Presidential Results:
32.2% Obama, 67.8% McCain
Average Partisan Results:
35.3% Democratic
64.7% Republican
Voting Age Demographics:
70.9% White
9.6% Black
16.6% Hispanic
1.4% Asian
District Summary:
Poor Chet Edwards is the last Democrat who could have made a decent showing in this district, and even in another 2006 like cycle I would bet against him in this district now. The old Democratic areas have solidly turned their backs on Democrats at every level of the ticket, and the rest of the district is so solidly Republican that not even The Texas Miracle himself couldn't win it any more. It was still a nice run while it lasted, and Edwards almost survived the DeLaymander of 2004.
TX-26 (Gray):
2008 Presidential Results:
65.4% Obama, 34.6% McCain
Average Partisan Results:
58.8% Democratic
41.2% Republican
Voting Age Demographics:
52.5% White
9.8% Black
31% Hispanic
4.9% Asian
District Summary:
Texas Republicans really don't like white Democrats, they don't want voters to see the Democratic party as the party of anything but lazy, welfare-dependent minorities, atheist heathens, and illegals. I'm pretty sure that Lloyd Doggett must keep State Republicans awake at night, unable to sleep. They probably even use his name as a curse-word substitute, (not to be confused with Dog-nab-it). They certainly have tried everything they could to get him removed from Congress. They failed again, thankfully, in their Gerrymander which cut Travis County up into a half dozen strips of bacon. In this map I took a more fair approach and kept it centered on Travis, looping up into take in the swingish and Democratic-trending towns of Georgetown and Round Rock in Democratic-trending Williamson County. The result looks either like the yin-yang symbol, or a pair of tadpoles making love, depending on your personal brand of spirituality I guess. Backbencher Conservative Congressman John Carter also technically lives here, but I assumed he would run in TX-27.
TX-27 (Neon Turquoise):
2008 Presidential Results:
54.5% Obama, 45.5% McCain
Average Partisan Results:
45.9% Democratic
54.1% Republican
Voting Age Demographics:
64.2% White
4.7% Black
22.6% Hispanic
6.7% Asian
District Summary:
This is certainly where John Carter would run. I think it would still qualify as a swing district in the 2012 election, (but not much longer). Travis and Williamson Counties are rapidly growing and trending Democratic quite rapidly. John Carter isn't exactly experienced in running competitive campaigns. However, the Austin Metropolitan area does deserve and should have two districts. This one takes on the western portion of Austin, and Sunset Valley plus some more swingish, suburban territory on the outer edges of the county and the more conservative suburbs in south Williamson County. It could be a marquee battle, or the Democrat could coast to an unexpectedly easy victory over a weak Republican incumbent who had never run a competitive General Election campaign. This is infinitely more fair than the Republican map which attempts to deny any representation to the growing population of Democratic leaning votes and communities in Travis County. (And showing their racist assumption that to get rid of Doggett they just needed to put in a more Hispanic district, because minorities totally always vote for other minority candidates over the white guy, regardless of the issues and campaign, right?).
TX-28 (Plum):
2008 Presidential Results:
42.1% Obama, 57.9% McCain
Average Partisan Results:
40.5% Democratic
59.5% Republican
Voting Age Demographics:
61.4% White
11.4% Black
23.2% Hispanic
2.1% Asian
District Summary:
Rep. Mike McCaul's district is already a strange mixture of Austin and Houston suburbs with a lot of Republican rural space in between. I think I made it less weird, if more bulging, by removing the Travis and Harris County portions of the district. It's a little bit more Republican than McCaul's last district, though probably not as favorable as the one Republicans drew for him. Still highly unlikely to support any Democrats over the decade, but not an overwhelmingly partisan seat as far as Texas goes.
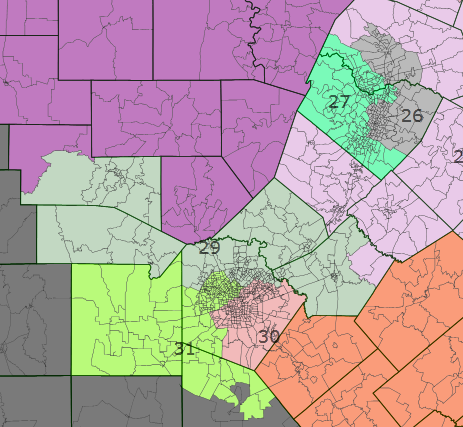
TX-29 (Sea Gray):
2008 Presidential Results:
33.8% Obama, 66.2% McCain
Average Partisan Results:
28.1% Democratic
71.9% Republican
Voting Age Demographics:
62.5% White
4.3% Black
29% Hispanic
2.7% Asian
District Summary:
This is the district of Representative Lamar Smith. I think I made it even more Republican and exurban than it previously was or is under the Republican map. It contains all of Bandera and Comal Counties, as well as most of Kerr and Guadeloupe Counties, although the bulk of it's population consists of north Bexar County San Antonio suburbs. Really isn't a district going anywhere any time soon.
TX-30 (Coral Pink):
2008 Presidential Results:
63.2% Obama, 36.8% McCain
Average Partisan Results:
61.2% Democratic
38.8% Republican
Voting Age Demographics:
24.4% White
9.5% Black
63.7% Hispanic
1.3% Asian
District Summary:
This is Rep. Charlie Gonzales', who is retiring, seat. It was a rather fortunate thing that he did retire, as State Rep Joaquin Castro, twin brother of San Antonio Mayor Julian Castro, had been running a heated campaign against Lloyd Doggett that promised to be extremely expensive and divisive. This version is probably a few points less Democratic than the old and current Republican version, but not actually enough to significantly affect the lean of the district one way or another.
TX-31 (Chartreuse):
2008 Presidential Results:
53.9% Obama, 46.1% McCain
Average Partisan Results:
49.6% Democratic
50.4% Republican
Voting Age Demographics:
31.6% White
5.2% Black
58.8% Hispanic
2.9% Asian
District Summary:
Republican Quico Canseco currently holds this district. At the moment, in the current version, State Rep. Pete Gallego and former U.S. Rep Ciro Rodriguez (ousted in 2010), are currently in a runoff to see who will face Rep. Canseco in the fall. The Republican version includes a lot more rural territory, and Obama only got 48%. This version is more San Antonio centric, and significantly more Democratic, but still very swingish, if Democratic trending. It is still a marquee race, and for my tallying, a swing/toss up district, for the moment. It also reflected my opinion that San Antonio should really have more political power over two districts, as opposed to just packing it into my 30th, Gonzales' district.
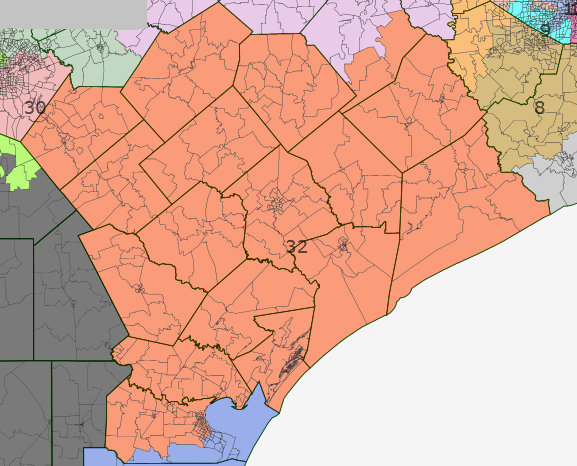
TX-32 (Orange-Red):
2008 Presidential Results:
40.3% Obama, 59.7% McCain
Average Partisan Results:
44% Democratic
56% Republican
Voting Age Demographics:
45.5% White
5.5% Black
47.2% Hispanic
District Summary:
No story was more shocking in 2010 than 14 term incumbent Solomon Ortiz losing to a the co-host of a local conservative radio show in a race no one was following and paying attention. Of course Ortiz lost because he didn't pay attention to the race, and had no field program. Indeed a local Democrat noted that in Corpus Christi Democrats are deeply unorganized and were unprepared to get out the Hispanic vote, and indeed made no real effort at GOTV at all in 2010. I would hope in the future the party doesn't make such mistakes. Republicans came under some criticism for their map, where they detached Rep. Blake Farenthold's district from the southern, more Hispanic areas, and expanded it northward into whiter and more rural, Republican areas. Well, I ended up getting stuck doing essentially the same because this area kept being the odd-man out in all my calculations and all the time I drew the map. This is a Republican-leaning district, a solidly such district. However it has a large Hispanic population, the average partisan numbers show a district where a competent, conservative Democrat could win if Rep. Farenthold proved incompetent or abrasive. This district ballooned out so much that I had devote an entire screenshot just to it.
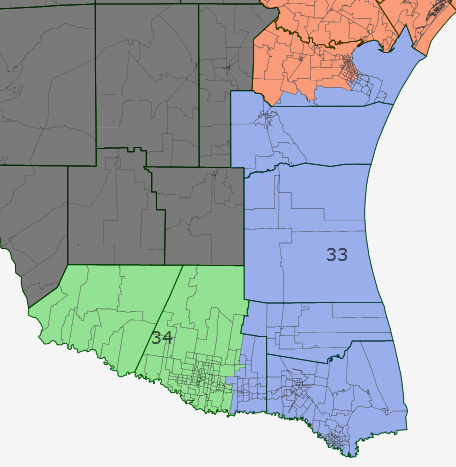
TX-33 (Blue-Gray):
2008 Presidential Results:
59.3% Obama, 40.7% McCain
Average Partisan Results:
57.8% Democratic
42.2% Republican
Voting Age Demographics:
20% White
1.0% Black
77.2% Hispanic
1.3% Asian
District Summary:
Well, what I did after detaching Blake Farenthold's district from the southern end of it, was I made another new district there in it's place, stretching from Brownsville to take in some southern neighborhoods of Corpus Christi, along with a bit of eastern Hidalgo County. Huge problems with turnout here, no doubt because a large portion of the Hispanic population here isn't eligible to vote. However, I think Democrats could still get a lot more votes with more registration and outreach, especially since this a very poor district, and quite marginalized. It's more Democratic though than the previous Ortiz district, and probably couldn't be won by a Republican even in a 2010 type setting with low turnout.
TX-34 (Pine Green):
2008 Presidential Results:
69.7% Obama, 30.3% McCain
Average Partisan Results:
67.3% Democratic
32.7% Republican
Voting Age Demographics:
9.8% White
88.5% Hispanic
1.1% Asian
District Summary:
I'm pretty sure this would have to be the most heavily Hispanic district in the country, and the least white district. Perhaps the only district where a majority of residents would be more comfortable speaking a language other than English. Horrible turnout here, which means that for all their big margins, Democrats don't actually pull much raw-vote totals for a Statewide election here. It contains all of Starr and most of Hidalgo County. This is the district that Rep. Ruben Hinojosa would run in, and although it represents a much more compact district than his prior, sprawling Rio Grande Valley district that also took in some Republican rural areas in the north, he's already represented most of the population of the current version.
TX-35 (Black):
2008 Presidential Results:
63.7% Obama, 36.3% McCain
Average Partisan Results:
66.5% Democratic
33.5 Republican
Voting Age Demographics:
14.1% White
84% Hispanic
District Summary:
Representative Henry Cuellar has never been a favorite of the left, I think, however, that since 2006 he has worked hard to gain acceptance in the national Democratic party and in the House Democratic caucus. He's hardly been a liberal Congressman, but on most of the important votes of the Obama Presidency, Rep. Cuellar has been a yes, even if a reluctant one. It would interesting to see him run statewide, either for Senate or Governor, if he had the ambition and was willing to dump this safely Democratic and overwhelmingly Hispanic House seat, (one that is also simply physically enormous). As some with both a Juris Doctor and a PhD, Cuellar is a highly educated and erudite Hispanic politician, the son of immigrants with little education. He's also a very experienced politician and is the sort of Hispanic Democrat who could play pretty well statewide, so, like I said, any such run from him would be interesting, but more likely than not, he'll stay put in this district that takes in his base of Webb County (Laredo), and stretches all the way across the state to take in some of the southern fringes of El Paso County.
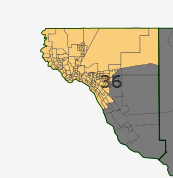
TX-36 (Mango Orange):
2008 Presidential Results:
65.6% Obama, 34.4% McCain
Average Partisan Results:
62.2% Democratic
37.8% Republican
Voting Age Demographics:
16.7% White
3% Black
78.1% Hispanic
1.3% Asian
District Summary:
El Paso City Councilman Beto O'Rourke recently defeated long-time incumbent Silvester Reyes by a surprisingly strong margin, avoiding the need for a run-off (and once again confusing Republicans who think minorities as block groups who vote according to tribalism). It was a bit of stunner for me, as not Rep. Reyes had done was particularly bad, and insofar as voting records, they both had their strong points and both had some baggage. I think it likely that the very nasty campaign waged by Reyes ended up backfiring. The winner of the Democratic primary is the de facto next Congressman, in this heavily Democratic district, growing fast and trending more so, it's contracted more, but still is a neat, compact district containing all of El Paso and some of the immediate suburbs. One thing that must worry Texas Republicans is how three of the fastest growing areas in the state are El Paso, the Brownsville Metropolitan area, and the San Antonio-Austin area, and all three are heavily Democratic and trending further in that direction.
--
To wrap up Texas, my final count of this map, assigning districts a partisan lean, go as follows:
20 Safely Republican districts, 11 Safely Democratic districts, and 5 swing districts. Part of the stated goal of the project was to create swing districts where possible (in polarized Texas this was very hard) and without violating the VRA or community interests where those were clearly defined. This is hardly a superb or perfect map, as it lacks the input of discussion necessary for a true measurement of communities of interest, but it makes an attempt to judge geography and balance out the goals. I would say that all 5 swing districts should probably be won by Democrats, particularly 31, 27, and Gene Green's 12th district (under my map). Within two cycles, I think it all but certain Democrats would hold all the swing districts, making the state 20-16 in it's delegation. That means Democrats would have 44.4% of the delegation. Obama got 43.6% of the vote in 2008, and I'd expect demographic changes and a higher percentage of the Hispanic vote to push him around a percentage point in Texas even if he loses nationwide, and perhaps closer to two percentage points if he wins nationwide. So, for, the second time, I've put together an honest to god, perfectly balanced congressional map.
I suppose the next installment in my series should be my Georgia map, which I found to be pretty interesting (even if Georgia was low on the list of blatant GOP Gerrymanders). After Georgia I still have examples with North Carolina and Ohio to dive into, so it should be a while yet before I am finished with this series.
P.S. While Dkos does have reader guages, these aren't entirely accurate. I always appreciate users who vote in my poll as that gives a more accurate count of readership. Which is always nice to know for something you worked hard on; sucks to feel like you are talking to a wall.

