I conducted analyses of four national economic variables, unemployment, growth, inflation, and budget deficit (or surplus), to determine whether Democratic or Republican presidents are associated with better national economic outcomes.
While the analyses parallel numerous efforts diaried by others in DK and elsewhere, I have tried here to be rigorous as well as to boil down the results into an easily viewed and comprehensible form.
Pass through the orange cloud to view the results.
The following set of graphs (Figure 1) illustrate the results of the analyses. Modern Democratic presidents are associated with lower unemployment (upper left panel), higher economic growth (upper right panel), and lower budget deficits (or higher surpluses; lower right panel). Modern Democratic and Republican presidents have had statistically indistinguishable inflation (lower left panel). Details of the analyses follow.
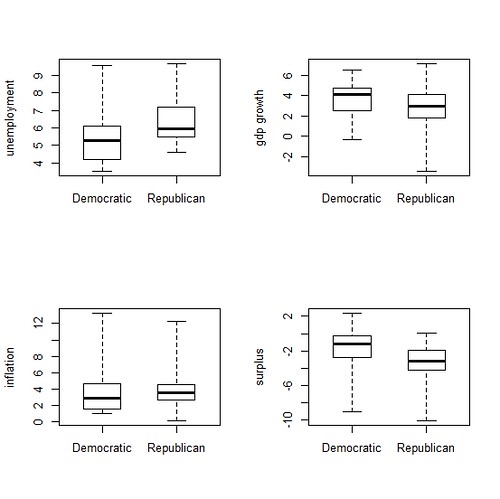
Figure 1. Box plots of economic performance data, 1960-2011. Data compiled from the 2012 Economic Report of the President, www.gpoaccess.gov/eop/index.html.
The analyses.
I assembled the data set (printed in full below) from the "2012 Economic Report of the President." The report is available online:
www.gpoaccess.gov/eop/index.html (Tables B-42, B-4, B-63, B-79)
Six variables are in the data set:
YEAR (1960-2011) I started the data in 1960, as a sort of general
beginning to the "modern" government/budget/economic era.
UNEMPL Civilian unemployment rate, in percent.
GDPGR GDP growth, as percent change, over previous year, in the real gross
domestic product.
INFLAT Inflation, as percent change in special consumer price index, December to
December.
SURPLUS surplus (positive) or deficit (negative) in federal budget, as
percent of gross domestic product.
PARTY political party of president responsible for that budget year,
R=Republican, D=Democratic.
One of the most important things that a president does to influence the economy is prepare/propose/haggle/& eventually sign, a federal budget. The federal budget in the first year of a president's term is set by the president in the previous year, so I used one year as a time lag. For instance, Kennedy took office in January, 1961, but he had effectively no budgetary influence until the new federal fiscal year began in the following October. Thus, I assigned 1961 as a Republican year as well.
The idea for this data set came from Michael Kinsley, writing for the Los Angeles Times, in an opinion column published in August, 2004. He took some of these variables and calculated the means of each variable within each party and compared them. He did not account for the variability in the data nor did he attempt any valid statistical inferences. For instance, just because the mean unemployment under Democratic presidents was smaller than that under Republican presidents does not mean that the result was unlikely to have happened under chance alone.
The graphs in Figure 1 above are "box plots" (sometimes called "box-and-whisker plots") for each variable, broken down by party. In each box, the middle thick horizontal line is the median, the lower and upper ends of the box are the 25th and 75th percentiles, and the ends of the "whiskers" show the locations of the lowest and highest values in the data. The displays are nice ways to display the centers as well as the variability (spread) of data sets (box-and-whisker plots were one of the many clever inventions of the pioneering statistician John Tukey).
The means (not the same as the medians) are not shown in Figure 1.
Here are the statistical analysis results in a nutshell:
Figure 1, upper left panel. Democratic presidents have been associated with lower unemployment. The difference in the unemployment distributions is statistically significant, that is, a difference this extreme is highly unlikely to have resulted by chance (two-sample Wilcoxon test, P=.01, two-sample t-test, P=.03).
Figure 1, upper right panel. Democratic presidents have been associated with higher GDP growth than Republican presidents. The difference is statistically significant (Wilcoxon P=.05, t-test P=.03).
Figure 4, lower left panel. Democratic presidents have been associated with slightly lower median inflation and slightly higher mean inflation. The differences, however, are not statistically significant (Wilcoxon P=.36, t-test P=.85).
Figure 1, lower right panel. Democratic presidents have been associated with higher budget surpluses (or lower deficits). The difference is statistically significant (Wilcoxon P<.01, t-test P=.03).
Each "P-value" reported above is the probability that the observed differences in the data between Republican and Democratic presidents would be as extreme if the R and D data were arising from identical distributions. The t-test results assume that the underlying distributions of data are normal symmetric bell-shaped curves, while the Wilcoxon results make far less restrictive assumptions (but are not quite as powerful for detecting differences).
Interpretation.
We can begin to construct hypotheses about why US economic variables do better under progressive federal budgets as opposed to conservative budgets. Progressive budgets tend to spread federal revenues among lower and middle income government employees, lower and middle income entitle-ees, and more numerous federal projects distributed more widely. The federal revenues are thus spent in communities more locally, contributing to local economies. Conservative budgets by contrast tend to concentrate revenues among rich cronies (defense contractors, for-profit health, for-profit education, etc.). Most importantly, conservative budgets do not lower deficits. Rather, conservatives have not been able resist the temptation to transfer federal revenues in various ways to their donor-clients, the investor class. Federal revenues do little to aid US economic health when languishing in offshore accounts.
Prevailing economic theories frequently have the actual scientific status of untested hypotheses and are based on assumed but potentially unreliable models of how the world must work. The economic assertions are handed down as received wisdom in economics textbooks. The economic dogmas of right-wing politicians (and many college economics courses) in fact are failing empirically. How many times have we heard "Governments don't create jobs"? "Increased employment produces inflation"? "Reduced government promotes growth of the private sector"?
The data.
The data, which are updated in a new report every year, served well as the basis for an assignment in the college statistics course that I teach. The data for the recent years in any given yearly report are usually preliminary and can change slightly in subsequent reports as the information becomes settled.
YEAR UNEMPL GDPGR INFLAT SURPLUS PARTY
1960 5.5 2.5 1.4 0.1 R
1961 6.7 2.3 0.7 -0.6 R
1962 5.5 6.1 1.3 -1.3 D
1963 5.7 4.4 1.6 -0.8 D
1964 5.2 5.8 1.0 -0.9 D
1965 4.5 6.4 1.9 -0.2 D
1966 3.8 6.5 3.5 -0.5 D
1967 3.8 2.5 3.0 -1.1 D
1968 3.6 4.8 4.7 -2.9 D
1969 3.5 3.1 6.2 0.3 D
1970 4.9 0.2 5.6 -0.3 R
1971 5.9 3.4 3.3 -2.1 R
1972 5.6 5.3 3.4 -2.0 R
1973 4.9 5.8 8.7 -1.1 R
1974 5.6 -0.6 12.3 -0.4 R
1975 8.5 -0.2 6.9 -3.4 R
1976 7.7 5.4 4.9 -4.2 R
1977 7.1 4.6 6.7 -2.7 R
1978 6.1 5.6 9.0 -2.7 D
1979 5.8 3.1 13.3 -1.6 D
1980 7.1 -0.3 12.5 -2.7 D
1981 7.6 2.5 8.9 -2.6 D
1982 9.7 -1.9 3.8 -4.0 R
1983 9.6 4.5 3.8 -6.0 R
1984 7.5 7.2 3.9 -4.8 R
1985 7.2 4.1 3.8 -5.1 R
1986 7.0 3.5 1.1 -5.0 R
1987 6.2 3.2 4.4 -3.2 R
1988 5.5 4.1 4.4 -3.1 R
1989 5.3 3.6 4.6 -2.8 R
1990 5.6 1.9 6.1 -3.9 R
1991 6.8 -0.2 3.1 -4.5 R
1992 7.5 3.4 2.9 -4.7 R
1993 6.9 2.9 2.7 -3.9 R
1994 6.1 4.1 2.7 -2.9 D
1995 5.6 2.5 2.5 -2.2 D
1996 5.4 3.7 3.3 -1.4 D
1997 4.9 4.5 1.7 -0.3 D
1998 4.5 4.4 1.6 0.8 D
1999 4.2 4.8 2.7 1.4 D
2000 4.0 4.1 3.4 2.4 D
2001 4.7 1.1 1.6 1.3 D
2002 5.8 1.8 2.4 -1.5 R
2003 6.0 2.5 1.9 -3.4 R
2004 5.5 3.5 3.3 -3.5 R
2005 5.1 3.1 3.4 -2.6 R
2006 4.6 2.7 2.5 -1.9 R
2007 4.6 1.9 4.1 -1.2 R
2008 5.8 -0.3 0.1 -3.2 R
2009 9.3 -3.5 2.7 -10.1 R
2010 9.6 3.0 1.5 -9.0 D
2011 8.9 1.7 3.0 -8.7 D
