Welcome to the 9th installment of my continuing series on the political geography of the United States. You can find part 8 on the districts in states A through M here, and the rest of the series on my page. In this segment, I turn my focus to the House of Representatives districts with a focus on their partisanship downballot. You can find my previous installment on the 2012 presidential election by district and the house of representatives elections themselves here. While presidential performance is a strong indicator of local congressional strength, there are many exceptions that range from small differences to astoundingly large ones as we'll see. As usual, my focus will cover the period from 2005 to present by calculating D vs R statewide election performance by district so that we may compare each district to its respective state and determine how that relationship trended over the last two downballot general election cycles such as 2006 and 2010. First let's take a look at the national map with the underlying geography of the districts, which party drew them, and their current representation in congress.
The districts:
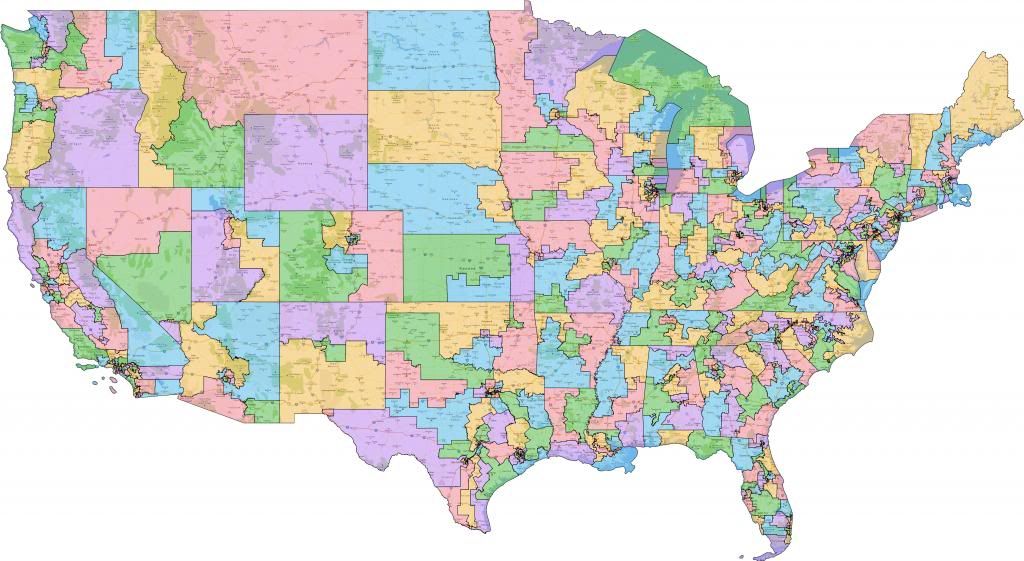
(full size image here)
By their numbers:
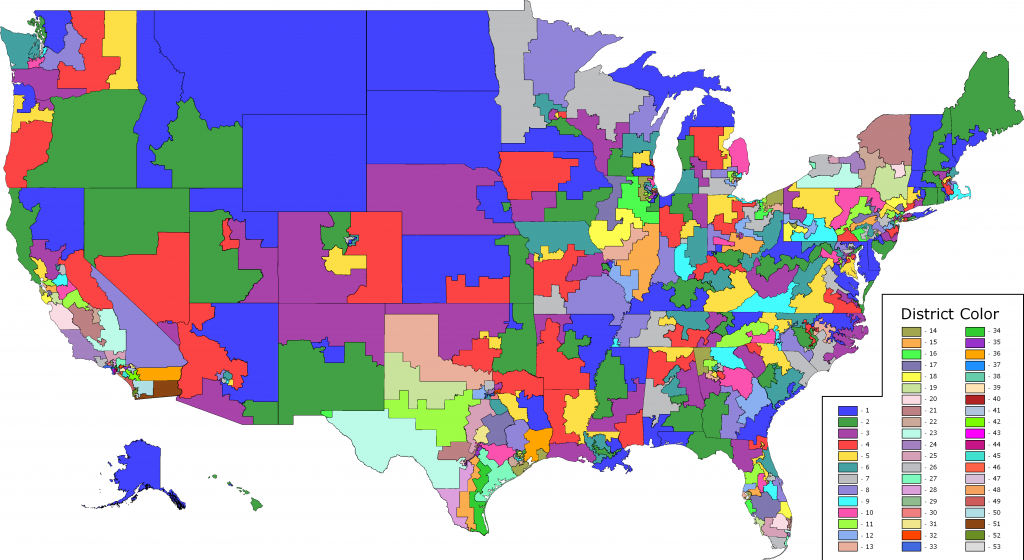
(full size image here)
By who drew them:
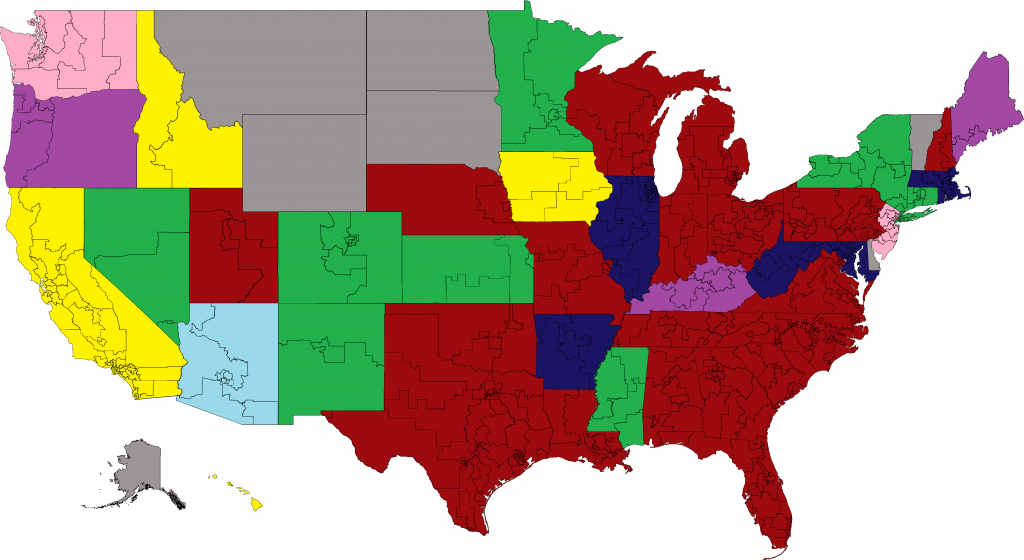
Blue - Democratic drawn
Red - Republican drawn
Purple - Bipartisan Compromise
Green - Court drawn
Light Blue - Independent Commission favorable to Democrats
Pink - Bipartisan Commission favorable to Republicans
Yellow - Nonpartisan-Independent Commission drawn
Gray - At-Large state
By their Representatives' party:
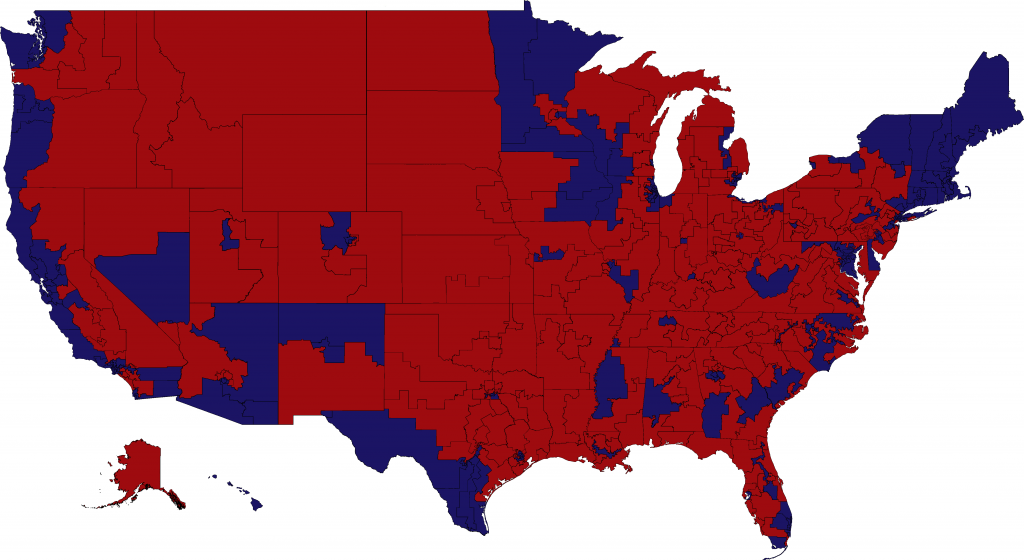
(full size image here)
This map can have every district's color (minus AK-AL and HI-02) changed with just one click, so feel free to download it and play around with it if you like. Remember, you can find interactive google based maps for every state here courtesy of Daily Kos Elections. All of the election by election data that went into making the following maps is available for download by state or if you just want the partisan averages and presidential numbers by district. This part will examine districts in states starting with N through W. So follow me over the fold for maps, and please note that the scale changes for some of them.
Nebraska
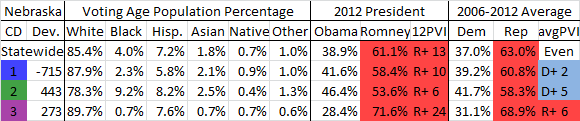
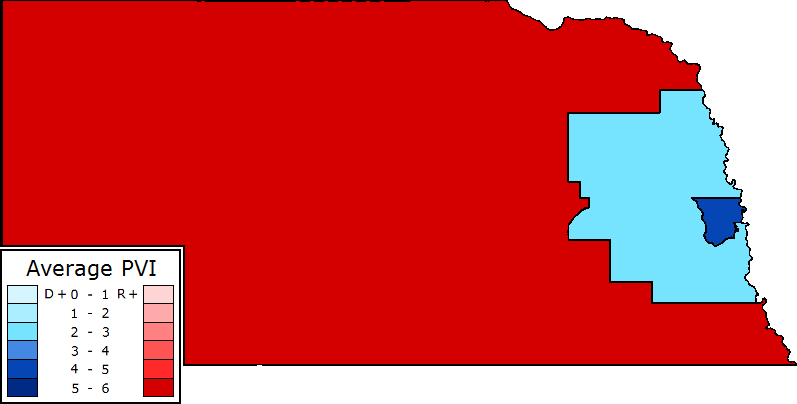
Nebraska is a fairly Republican state that they barely gerrymandered at all. They left the 2nd district as clearly the most Dem in the state, but it's still right leaning. However, Lee Terry is a weak incumbent and he makes this seat competitive, which resulted in us losing it by just 1.6% in 2012
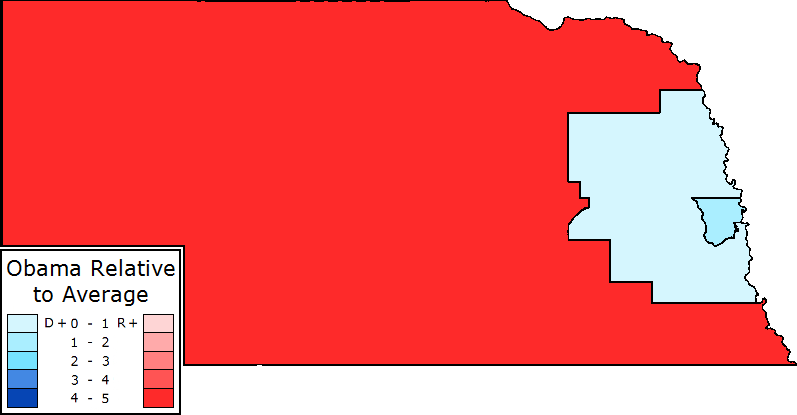
As is fairly typical, Obama drops off a little more in the much more rural district, the 3rd, and holds up best in the urban and less white 2nd. Part of this is due to Obama running saturation level ads in the Omaha media market to reach western Iowa.
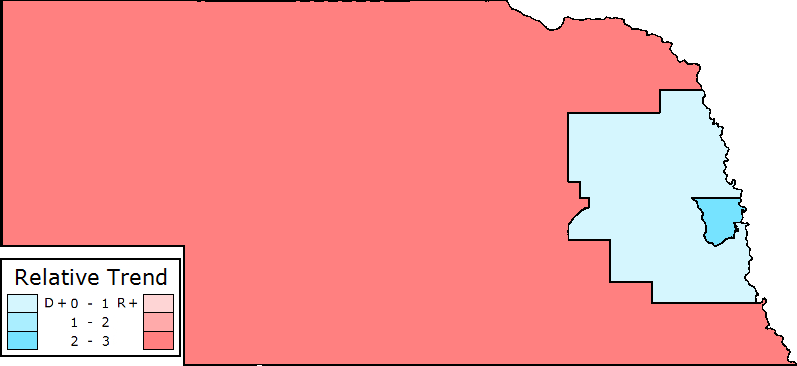
Also unsurprising is that the heavily rural 3rd trended Republican while the urban 2nd trended Democratic.
New Hampshire
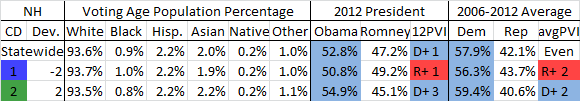
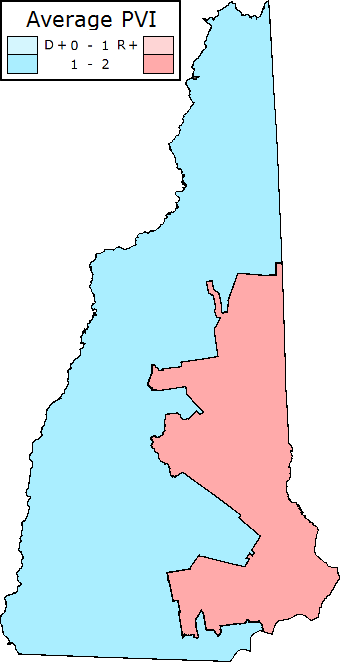
New Hampshire's districts were drawn by Republicans to very slightly shore up then 1st district Rep. Frank Guinta. As such, the 1st is somewhat more Republican than the 2nd, but both are fairly close together in partisanship.
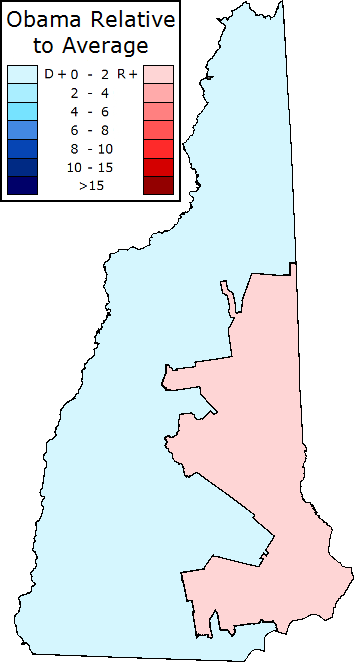
Given how both districts saw saturation level presidential campaigning, it's no surprise that Obama performs in a fairly typical pattern in both of them. New Hampshire, along with New Jersey and Tennessee below and Maine previously, only elects governors and senators statewide so there is nothing to average on a year by year cycle for the trend.
New Jersey
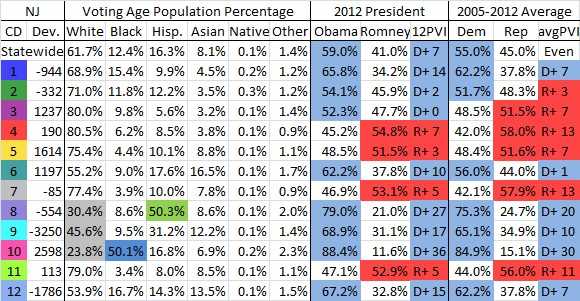
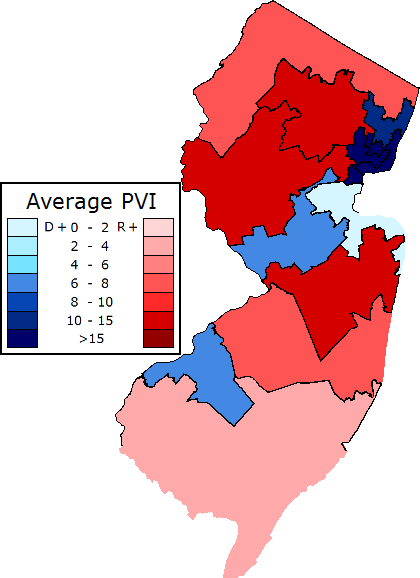
New Jersey is a solidly democratic state, yet saw Republicans draw a mild gerrymander through its bipartisan redistricting commission. Still there are 3 districts which should be competitive, the 2nd, 3rd, and 5th, however Frank LoBiondo in the 2nd is a very entrenched incumbent. If he were to retire, this seat would likely revert back to Democrats. The 5th is our best chance at a pick up in the state as Scott Garrett is probably the most conservative Republican in the northeast and a bad fit for a barely right leaning district.
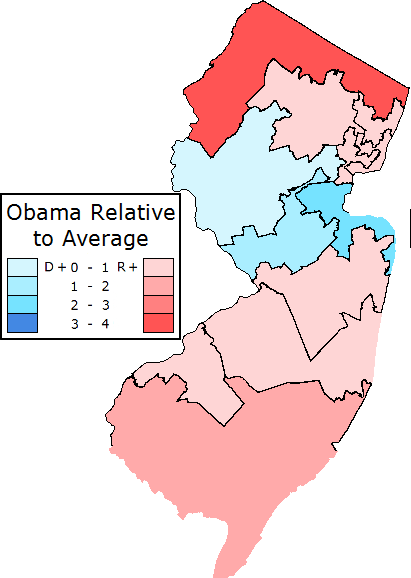
Obama ran very well in New Jersey thanks to the boost from Hurricane sandy, but it was in an uneven pattern. He overperforms the average in central New Jersey while underperforming considerably in the 5th to the point where he didn't win it, but Dems like Bob Menendez did. He also underperforms somewhat in the 2nd which is why I think it starts out as Lean D if LoBiondo retires, though our bench is somewhat thin there.
New Mexico
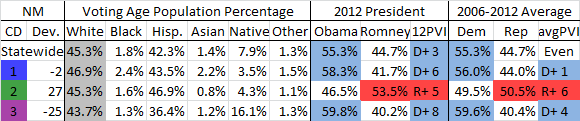
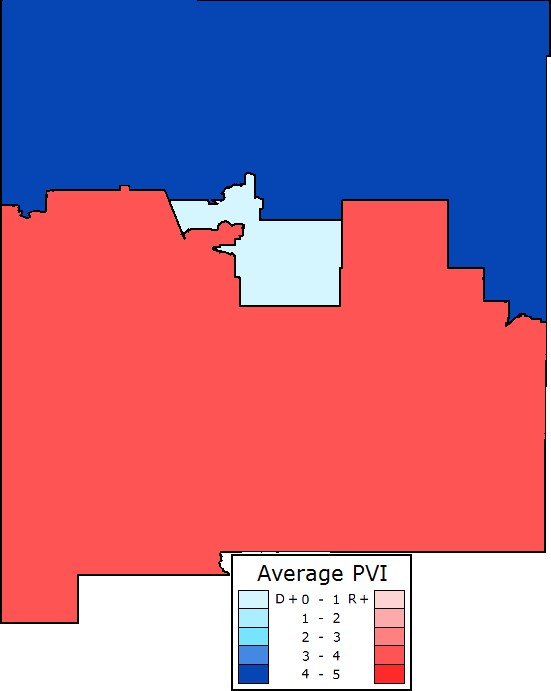
New Mexico is, like much of the nonwhite southwest, trending Democratic overall. The districts, which were court-drawn, have two clear Democratic districts and one Republican leaning district. Though the heavily white southeast is trending Republican, the 2nd district's large non-white population should on paper make this seat competitive at only 6 points more Republican than the state and given Steve Pearce's far right record, but for now he is safe.
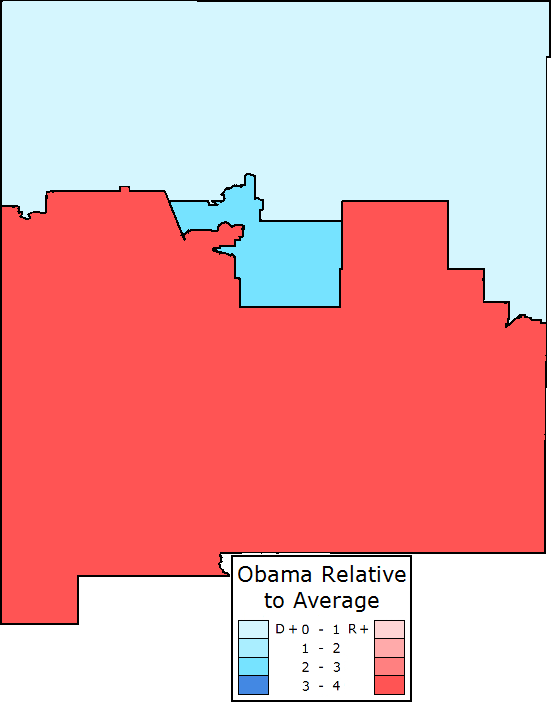
Obama underperforms in the 2nd, particularly thanks to those same heavily white counties in the east of the district that vote more like west Texas than the rest of the state. He does the best relative to the average in the most urban of the districts, the 1st.
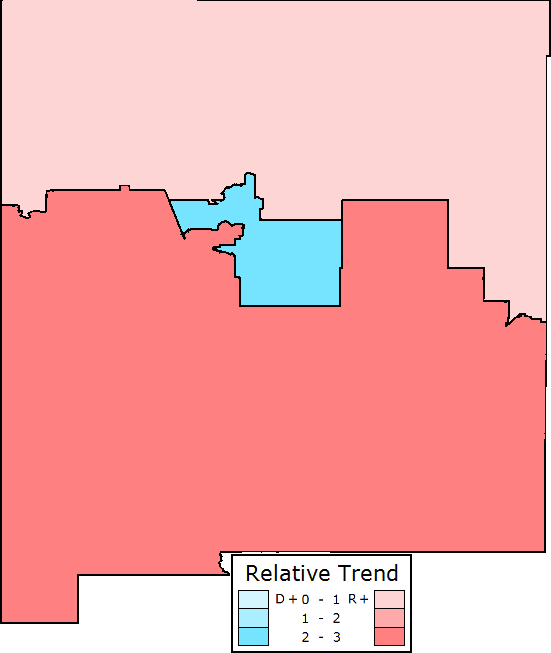
It should come as no surprise that the 2nd trended away from Dems while the 1st trended towards us, given how relatively rural the former is and how urban the latter is. Though the 3rd is heavily rural as well, it also has a huge minority population which acts as a buffer against the trend of the white vote.
New York
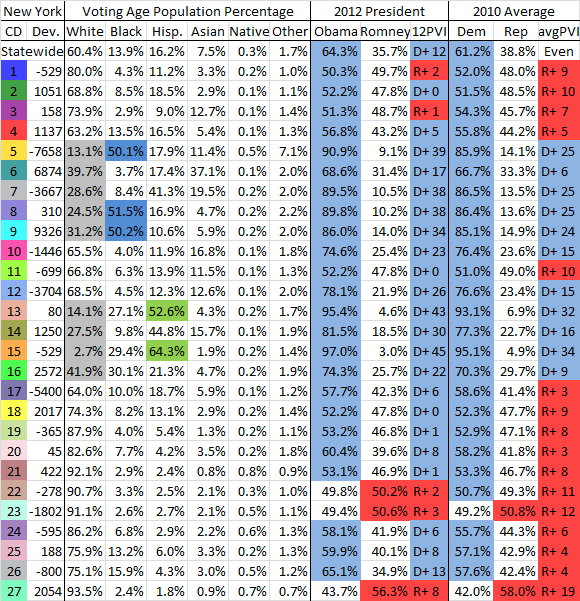
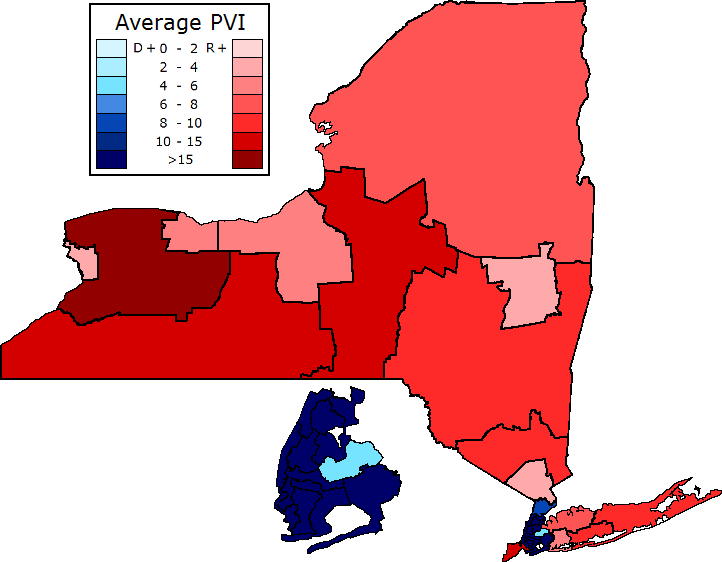
New York is a heavily blue state and thus many of these court-drawn districts that are quite amenable to Democrats appear red. Unfortunately I was unable to procure the 2006 results by district and the New York Board of Elections, which is horrendously bad, has even removed the 2010 results.
Anyway, as you can see the NYC districts aside from the Staten Island based 11th are all ridiculously democratic. The more suburban districts on Long Island, while still Dem leaning are to the right of the state. The most Republican districts and the only ones that actually lean Republican are upstate and in particular non urban western New York. Our best pick up opportunities continue to remain the 11th and 19th which lean somewhat Democratic locally, and the 23rd where Tom Reed has proven to be a fairly weak incumbent, as well as the 3rd if Pete King ever retires.
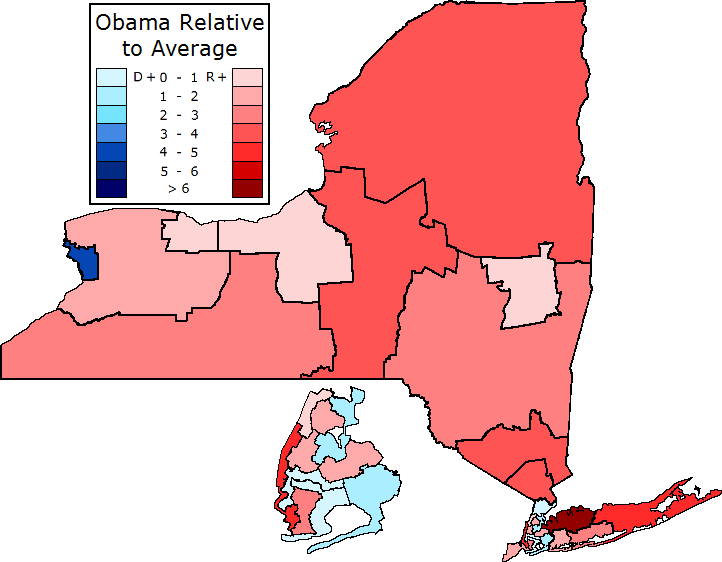
Obama underperforms very significantly in Steve Israel's 3rd district which I'm guessing is quite wealthy and open to Romney but not downballot Republicans. Additionally, he underperforms significantly in the Manhattan based 10th due to the large orthodox Jewish population there. He appears to underperform in some of the heavily minority NYC districts, but this is simply because they're maxed out and heavily inelastic even in 2010. In general he underperforms in much of Long Island as well as the 11th, plus nearly all of upstate.
Thanks to the Board of Elections being rather crappy, I have to rely on the county level results for the trend, but in general the Long Island districts were relatively neutral, the 11th trended Republican, and all of the upstate districts, particularly the northernmost 21st trended Democratic. The exception was in far western New York where the 26th in particular as well as the 27th trended Republican. Part of this was likely parochialism as Republican gubernatorial nominee Carl Paladino did very well there and the statewide ticket for Dems was mostly if not entirely from downstate.
North Carolina
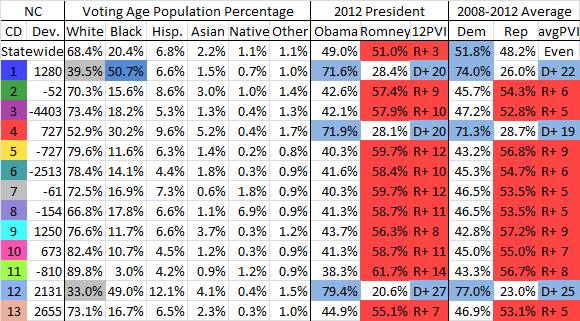
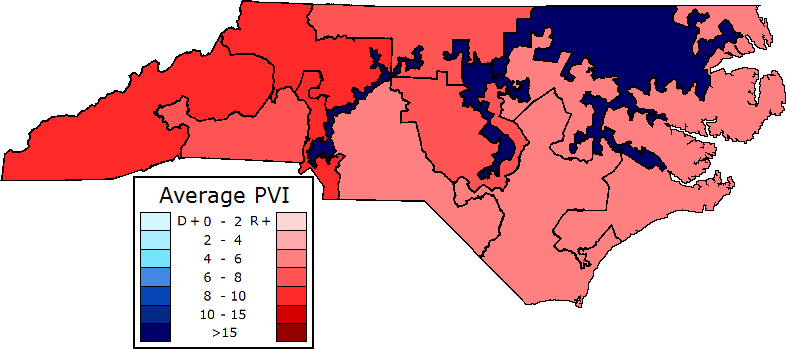
North Carolina Republicans went nuclear when they gerrymandered the state, almost sending a 10-3 delegation to congress in a state that voted Democratic overall. Thus, Dems are ridiculously packed into three vote sinks and Republicans efficiently spread out. Our best pick up opportunities would be the 9th and 13th though, while Republicans' target is the 7th. The 3rd would be competitive if Walter Jones ever gets teabagged, but with him there it's out of reach.
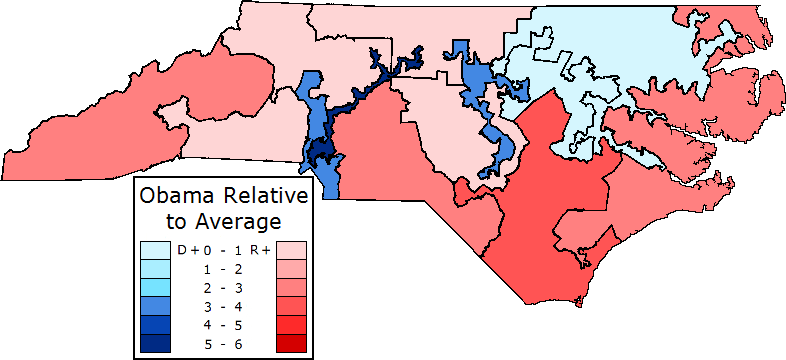
Despite it being a heavily contested swing state, Obama doesn't perform in the same pattern as the downballot ticket. He underperforms considerably in the more rural and white east far west of the state, while performing much better in the more urban districts in the Triangle area, Charlotte, and the Triad.
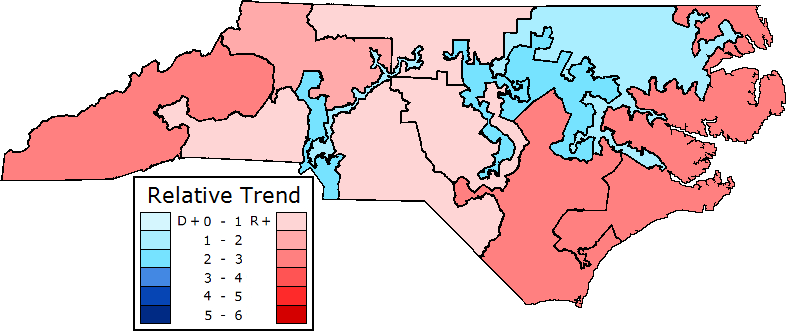
The trend is not particularly helpful for Democrats as the 7th is trending somewhat away from us. However the 9th and 13th both trended considerably Dem between 2008 and 2012 and should continue to do so.
Ohio
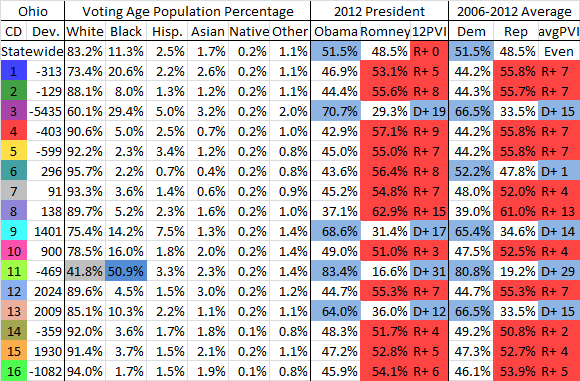
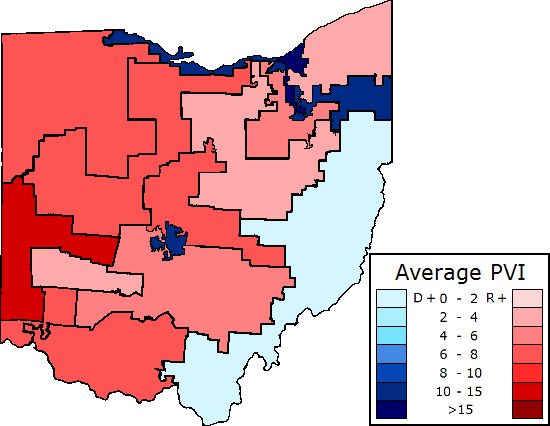
Competing with North Carolina for which state can we gerrymander the most aggressively, Ohio Republicans drew this ridiculous map that packs Dems into 4 vote sinks and allowed them to win 75% of the seats in a state that was basically 50-50. Still, our best chance at a pick up is probably the 6th, which was more Dem than the state from 2006-2012, and the 14th where untested incumbent David Joyce will face a strong challenge from one of Sherrod Brown's top fundraisers.
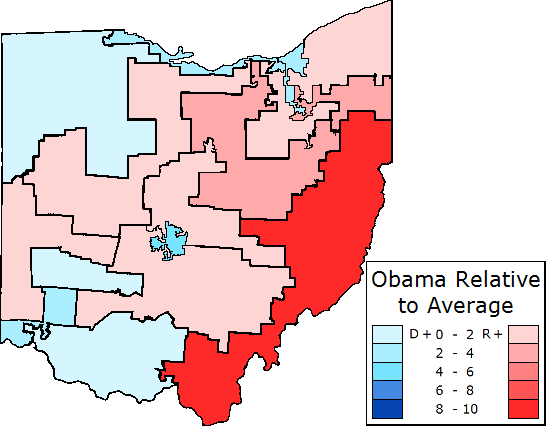
Obama performs well below average in the mostly Appalachian 6th as he does across that region. He also underperforms in the northeast in general, safe for the VRA black majority 11th and highly urban 9th. He overperforms the most in the big cities of central and southwestern Ohio such as the Columbus based 3rd and Cincinnati based 1st.
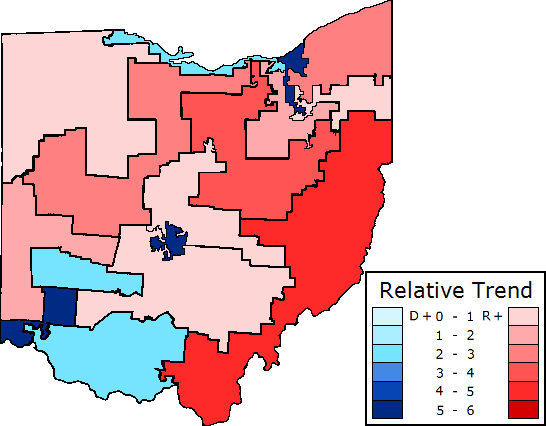
The trend is distinctively unhelpful to Dems from 2006-2010. The 6th trended strongly Republican as did the somewhat competitive 7th, 14th, and 16th. The 1st trended strongly Democratic, but is still Republican leaning. If Ohio Dems get their act together and pass an independent redistricting initiative, the 1st would become an easy pick up.
Oklahoma
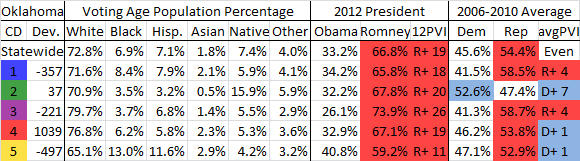
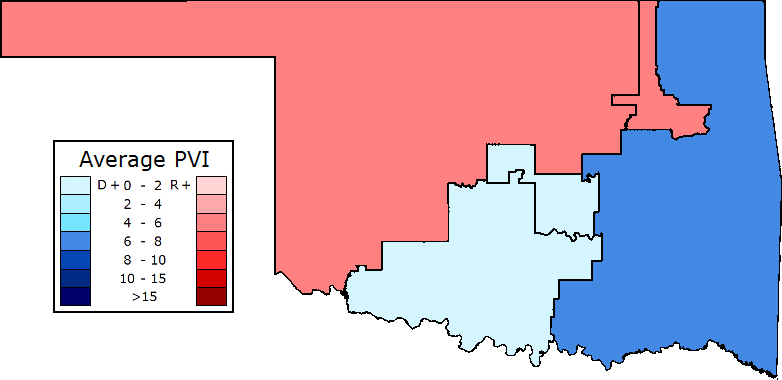
Oklahoma is one of the most Republican states in the country and as such Republicans didn't even have to gerrymander it hardly at all. The 2nd is by far the most Democratic district in the state and we held it until 2012, but the state is no longer competitive for Democrats and I bet Dan Boren would have lost it last year.
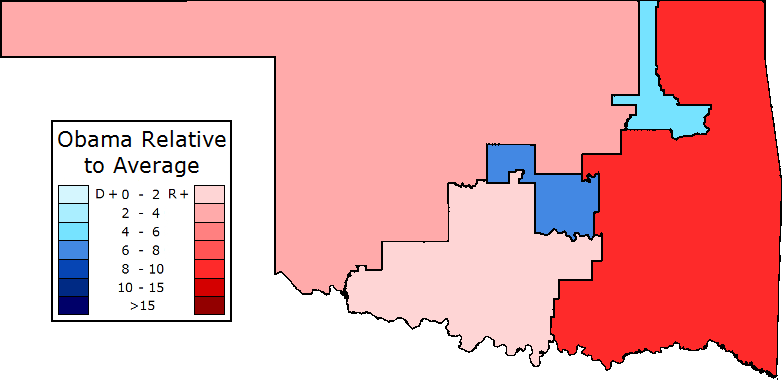
Obama performs somewhat below average in nearly all of the state, but it is most pronounced in the 3 heavily rural districts, particularly the conservadem heavy 2nd which still has a Democratic registration advantage if I'm not mistaken. He holds up much better in the more urban 1st and particularly the 5th where he performs about as well as our statewide candidates might do in 2014.
Overall Oklahoma saw a massive Republican shift from 2006 to 2010. Democrats went from holding nearly every single statewide office to losing all of them big. Much of this swing was driven by rural conservadems swinging to Republicans, thus the urban districts weathered the storm somewhat better. I would expect this patter to continue into 2014, but not be as pronounced as it was here.
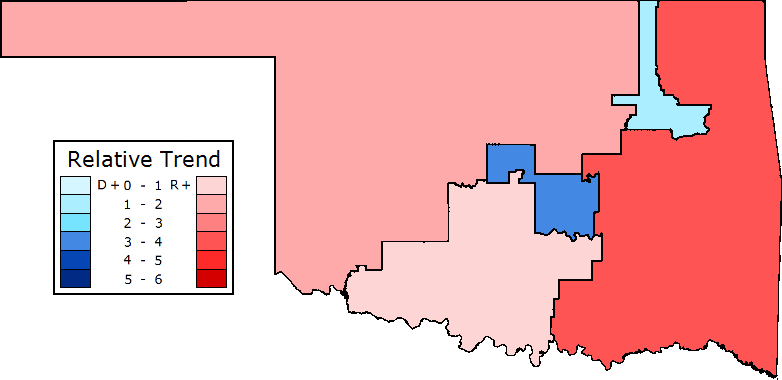
Oregon
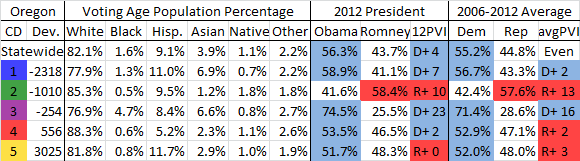
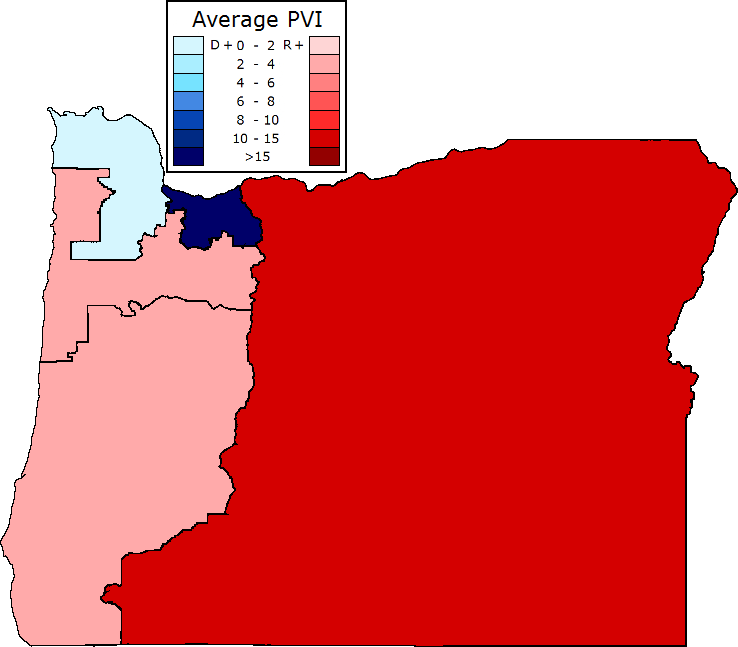
Oregon is a fairly solidly Democratic state and Dems were able to push through this mild gerrymander compromise. Republicans are packed into the safe R rural 2nd district while Dems are even more packed into the urban Portland based 3rd. The 4th and 5th are somewhat swingy Dem leaning districts, but they are relatively safe given the popularity of their Dem incumbents.
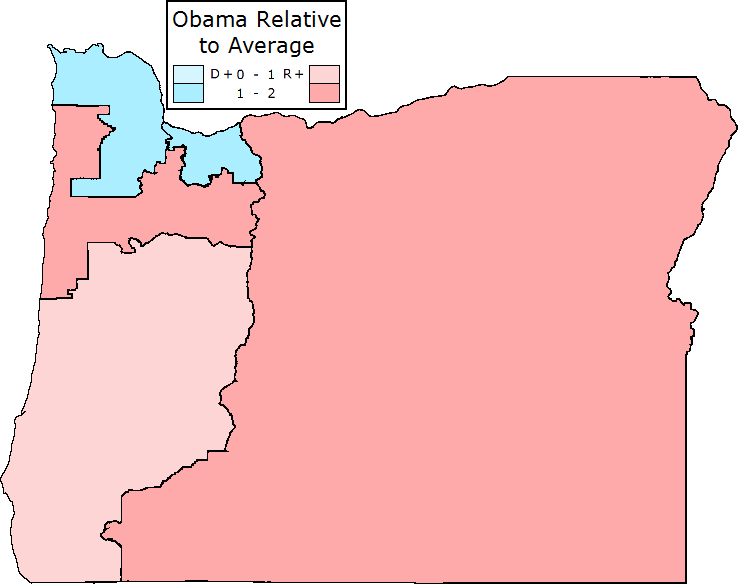
Unsurprisingly, Obama performs best relative to the average in the more urban and suburban 1st and 3rd while performing relatively worse in the more rural 2nd.
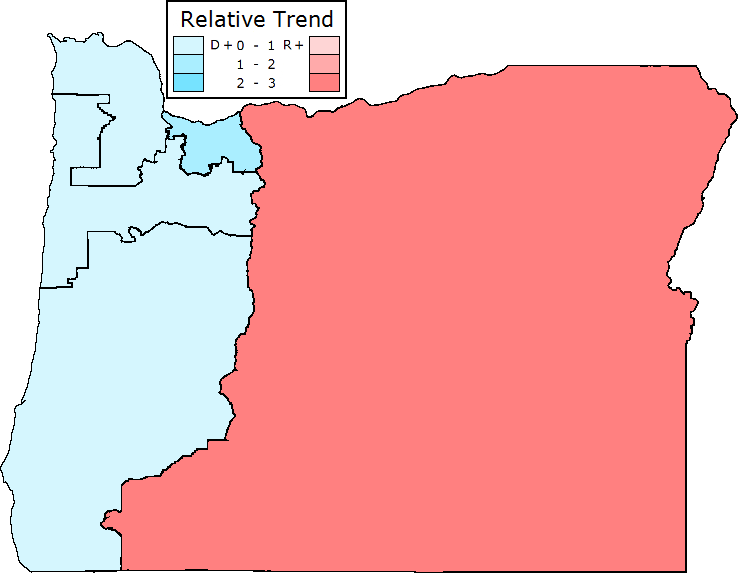
As other states have demonstrated, Oregon's districts fit the pattern of increasing polarization with the Republican district trending Republican and the Dem districts trending Dem. Fortunately as the state seems to be solidifying as a Dem stronghold where Republicans haven't won a statewide race since 2002, the 5th and 4th look to stay relatively secure.
Pennsylvania
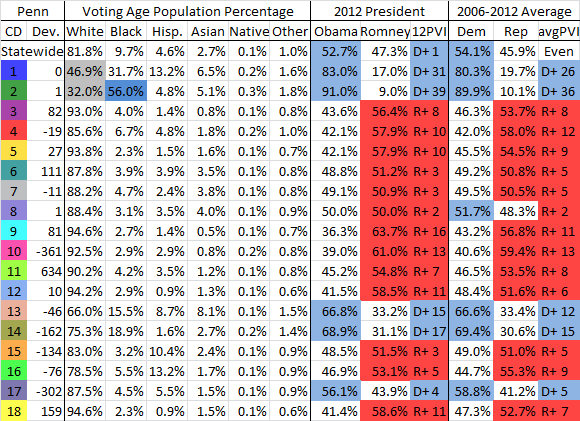
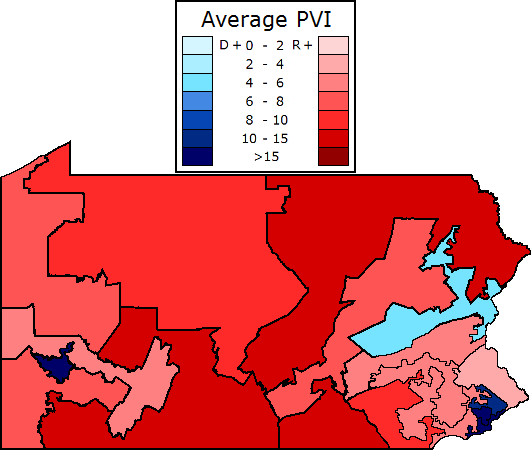
In third place behind North Carolina and Ohio, Pennsylvania is a state that Republicans took a hack saw to when they drew the map. Like North Carolina, the majority of the state voted for Dem candidates yet we only won 5 of 18 seats thanks to gerrymandering. Dems are ruthlessly packed into the urban Philadelphia and Pittsburgh districts as well as the sububan 13th and Scranton/Wilkes-Barre based 17th. All of the Republican districts are more Republican than the state, but the 8th remains our best pick up chance if Fitzpatrick honors his term limits pledge in 2016. Aside from that the 7th is the only other seat we might have a shot at.
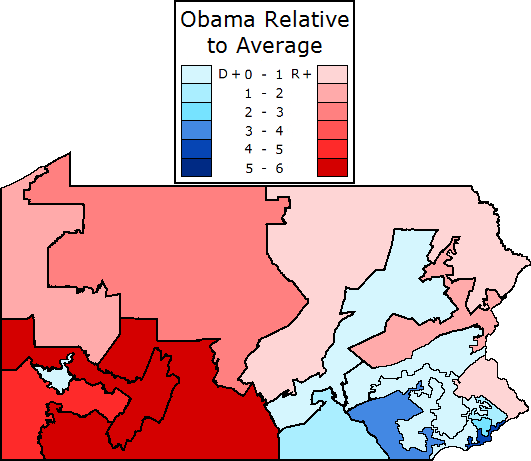
Obama underperforms considerably in the non urban western Pennsylvania districts while overperforming considerably in the Philadelphia based ones and the Pennsylvania Dutch country ones, particularly the 16th.
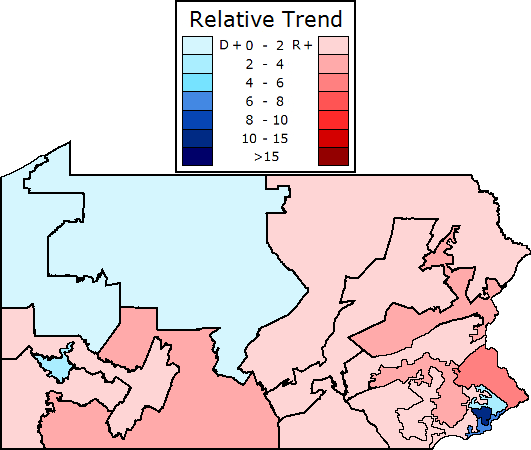
The 2006-2010 trend was quite unhelpful as all of the districts we might want to flip trended Republican, particularly the 8th
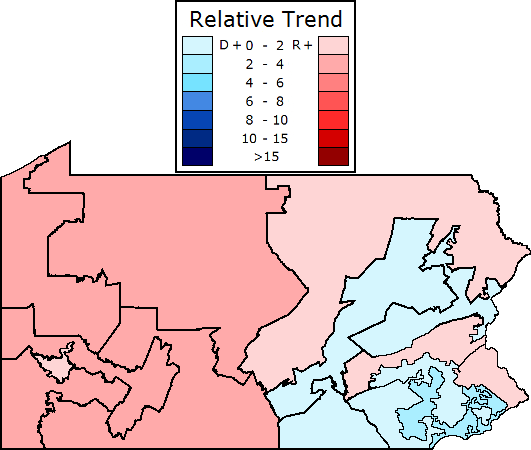
The 2008-2012 trend was somewhat more helpful in that the 7th trended Dem, but unfortunately all of western Pennsylvania trended Republican which caused us to lose the 12th.
South Carolina
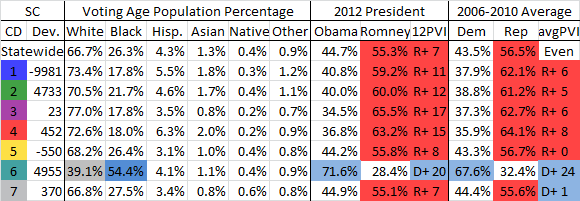
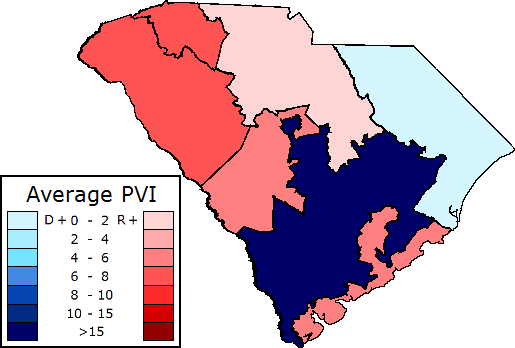
South Carolina was drawn by Republicans and packs Dems into the black majority 6th and makes all other districts safe. If we are to flip any of them, it would certainly be the 7th followed by the 5th where both Republicans won by about 10 points over nobodies in 2012.
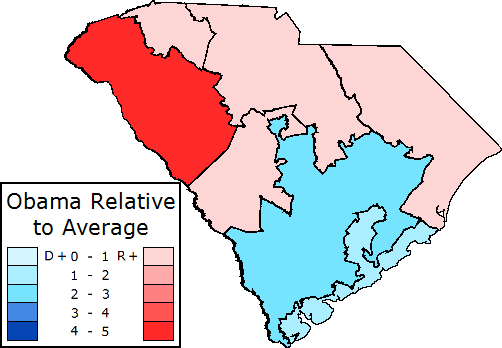
Obama performs in line with the average in most of the districts, but underperforms in the more Appalachian 3rd and overperforms in the heavily black 6th.
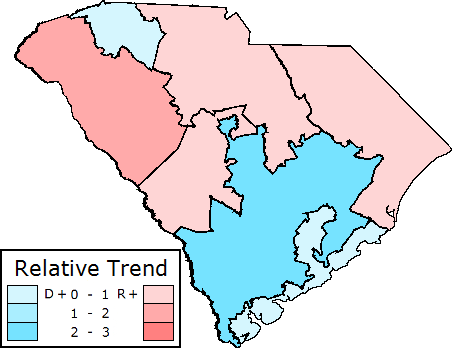
Typical of states with both Appalachian and minority populations, the Appalachian based 3rd trended Republican while the 6th trended Dem thanks to its relative inelasticity between 2006 and 2010.
Tennessee
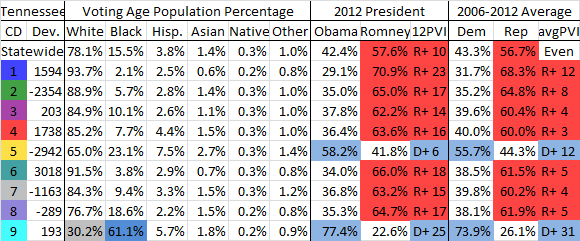
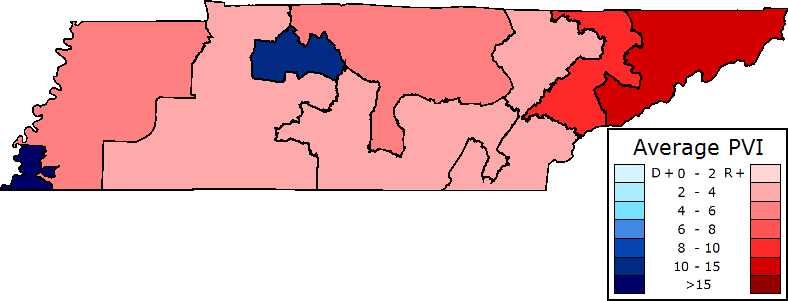
Tennessee Republicans drew a very mild gerrymander that didn't even change the seat share. Due to natural geography, Republicans are heavily packed into the easternmost districts which have been one of the most consistently Republican areas since the Civil War. Dems are heavily packed into the majority minority Memphis seat and the Nashville based district, while all other districts are safely Republican.
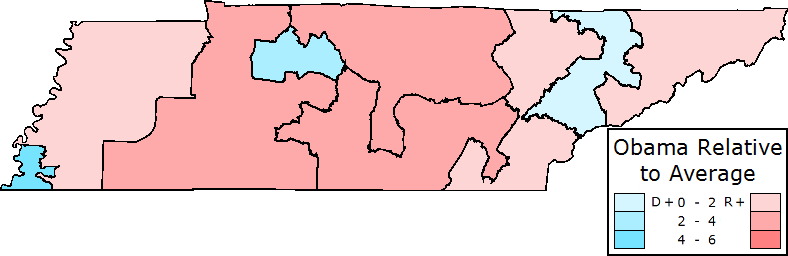
Obama undrperforms what Dems typically can get in contested statewide elections, but he holds up best in the more urban districts and underperforms the most in the more conservadem heavy 4th, 6th, and 7th.
Texas
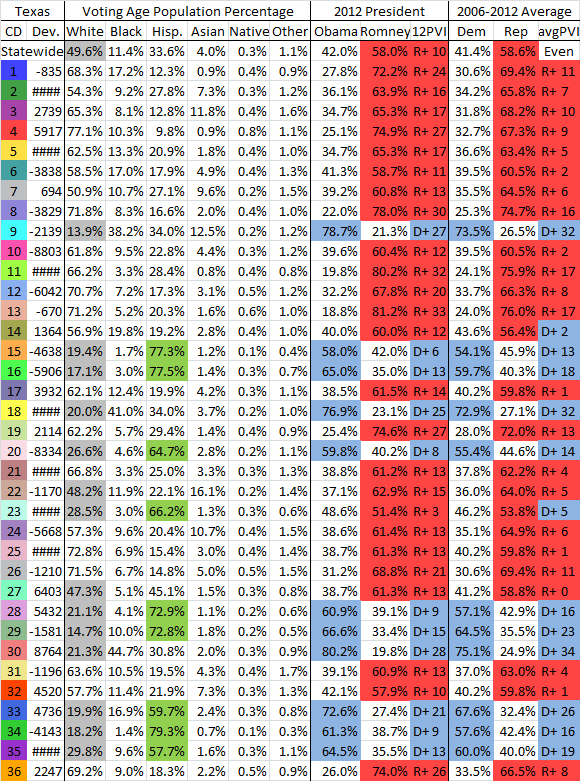
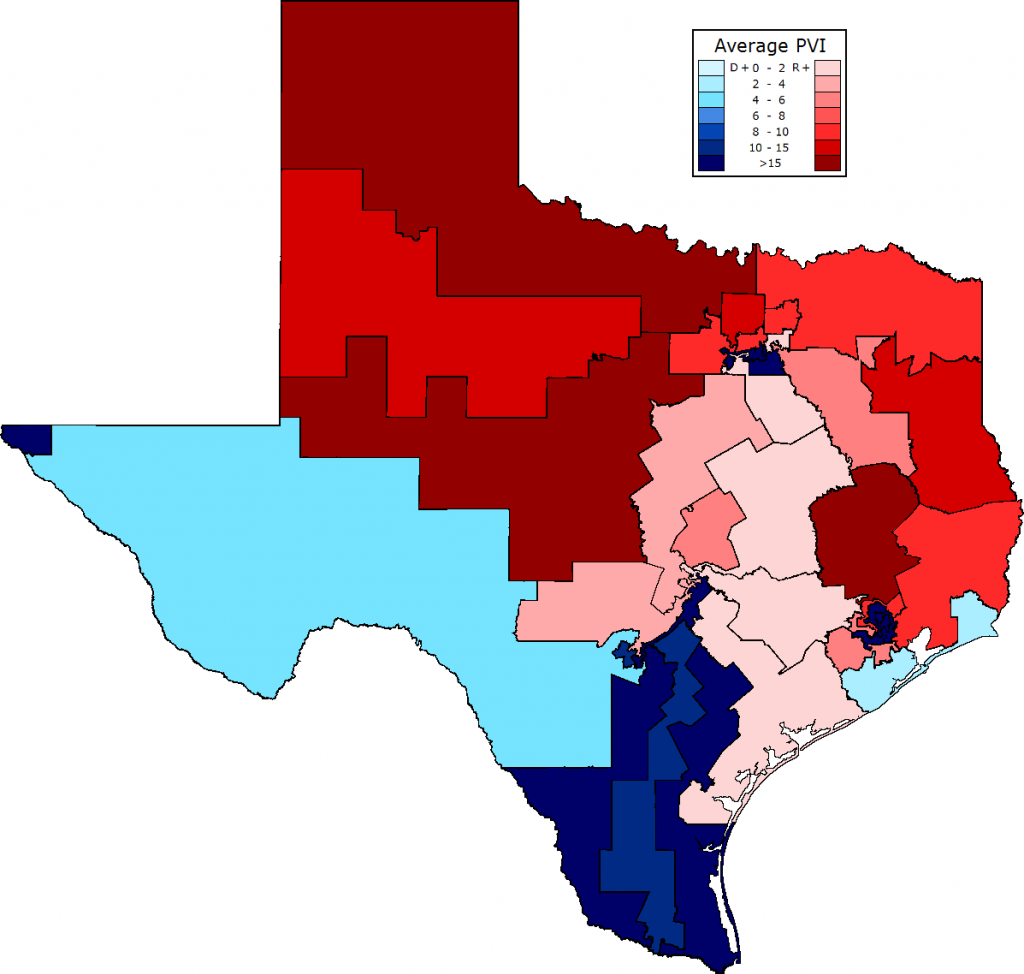
Republicans gerrymandered Texas and quite effectively packed Democrats into 11 districts, though two more remain competitive and we won one of them. Unfortunately there aren't any good pick up opportunities in the state seeing as our strongest possible candidate lost the 14th and the remaining districts are all too Republican
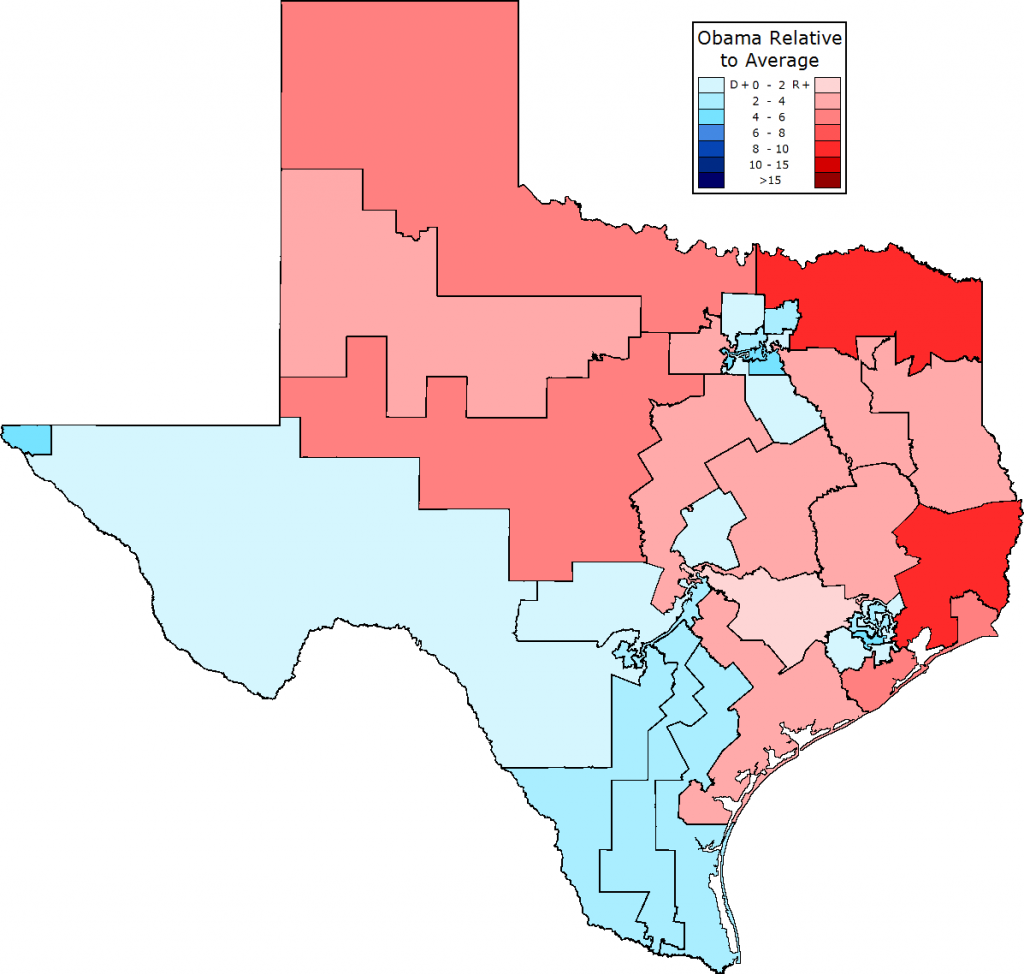
Obama underperforms significantly in the white rural districts, particularly those in eastern Texas, while he performs in line with the average or overperforms in all of the minority heavy, urban, and suburban districts.
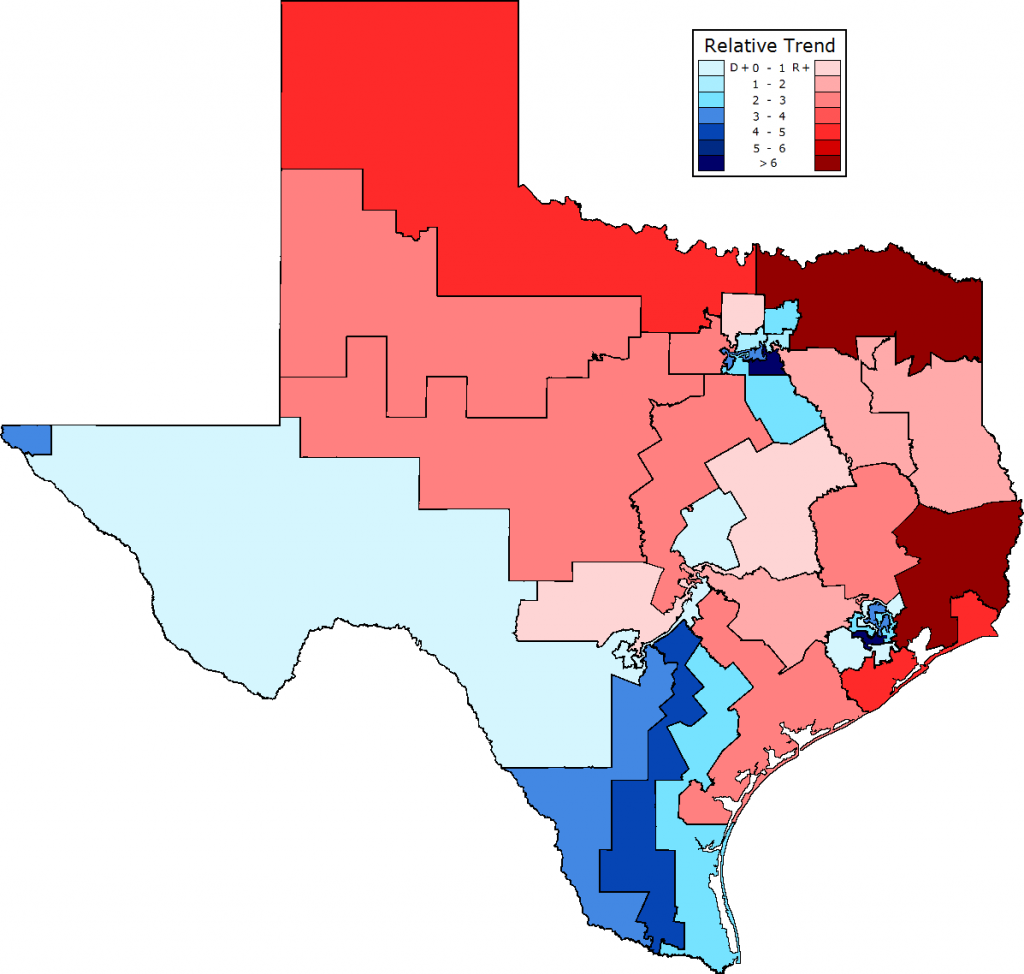
Between 2006 and 2010 there was a very sharp trend towards Republicans in all of the white rural districts, especially those in eastern Texas. Given their inelasticity, the heavily minority seats trended Dem but so did some of the staunchly Republican suburban ones such as the 3rd and 7th.
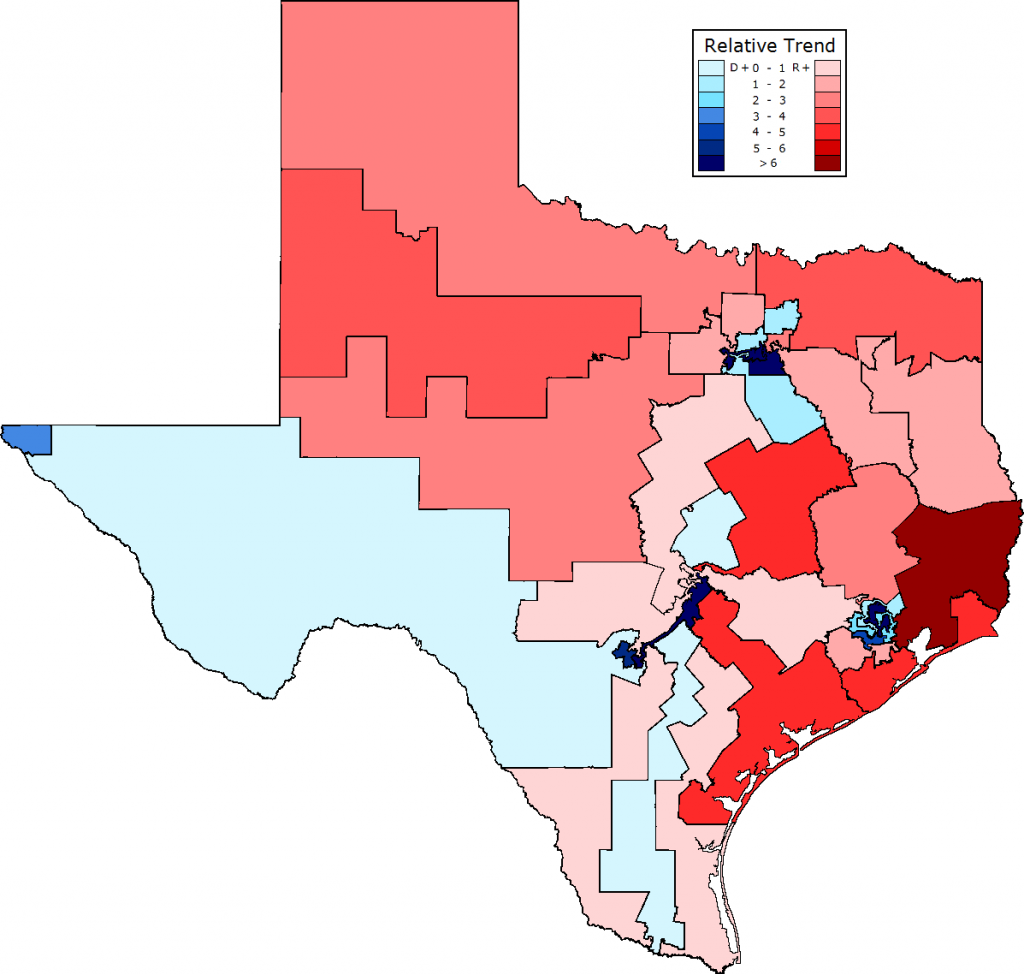
The 2008 to 2012 trend was somewhat different. The heavily white rurals still trended Republican, especially the southeast, but some of the heavily Hispanic districts such as those along the Mexican border were stagnant. The heavily minority urban districts in Dallas Fort-Worth, Houston, San Antonio, Austin, and El Paso all trended very strongly democratic.
Utah
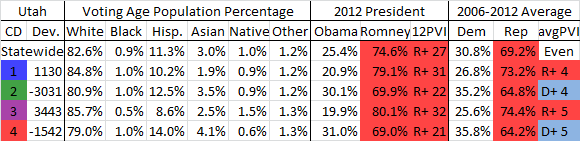
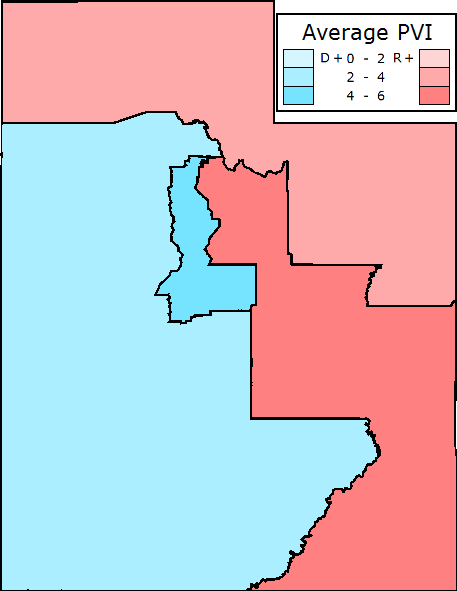
Utah Republicans drew a dud gerrymander when they cracked Salt Lake County several ways that, while making life quite difficult for Jim Matheson, he was able to eke out a narrow upset win in 2012, leaving him holding the most Republican constituency in both chambers of congress. As you can see, his Salt Lake County based 4th is the most Democratic district in the state but is still very Republican.
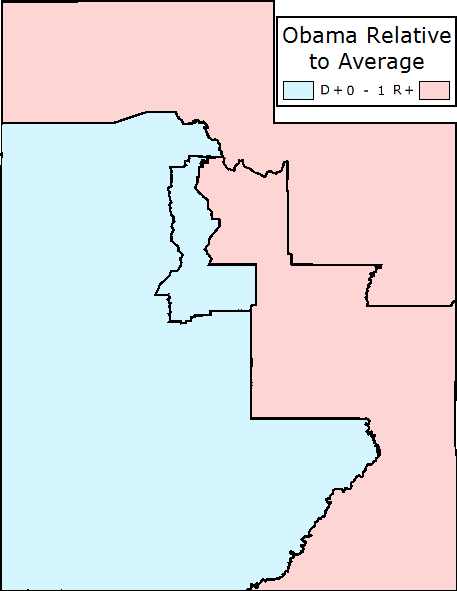
Given Romney's Mormonism contributed to a massive boost in Mormon majority Utah, Obama underperforms everywhere in the state and in a fairly even pattern across the districts.
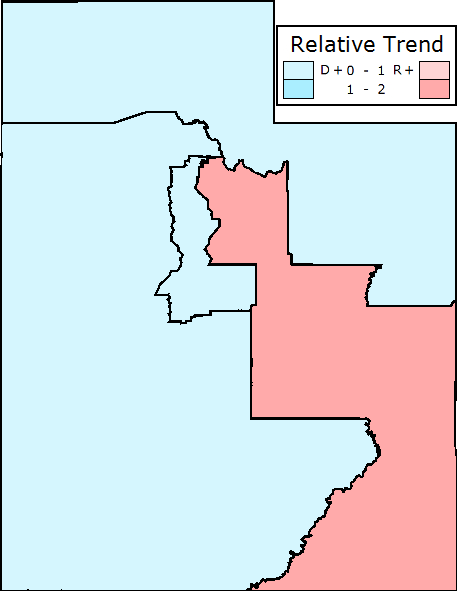
Fortunately for Matheson, his district is slowly but surely trending Democratic, while the 3rd trended Republican.
Washington
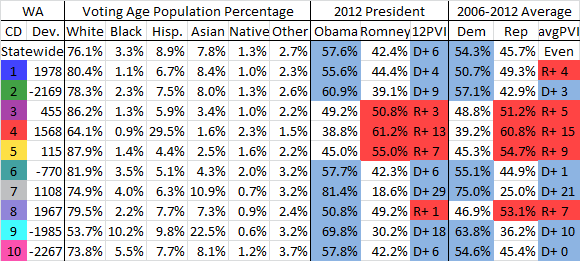
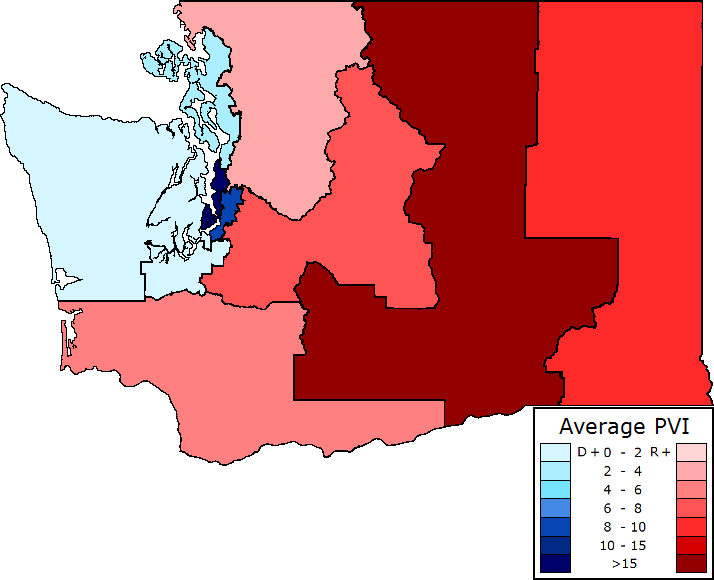
Like New Jersey, Washington's bi-partisan commission saw Republicans push through a modest gerrymander. There are 6 strongly Democratic districts and 4 that are favorable to Republicans, particularly the two east of the cascades. We should continue to make a push for the 3rd and 8th if we are to gain any seats in the state. The 3rd district was the median district at Romney's 218th best and if we're to retake the House we need districts like it to fall.
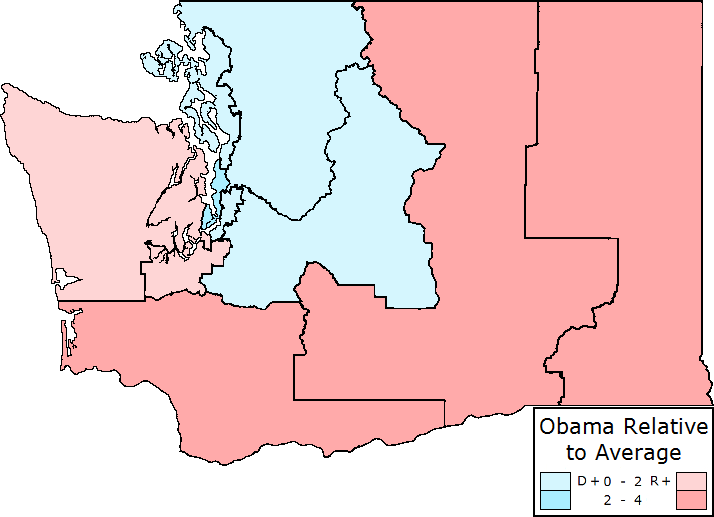
Obama performs fairly in line with the average in the Puget Sound area districts, but underperforms somewhat in the 3rd, 4th, and 5th.
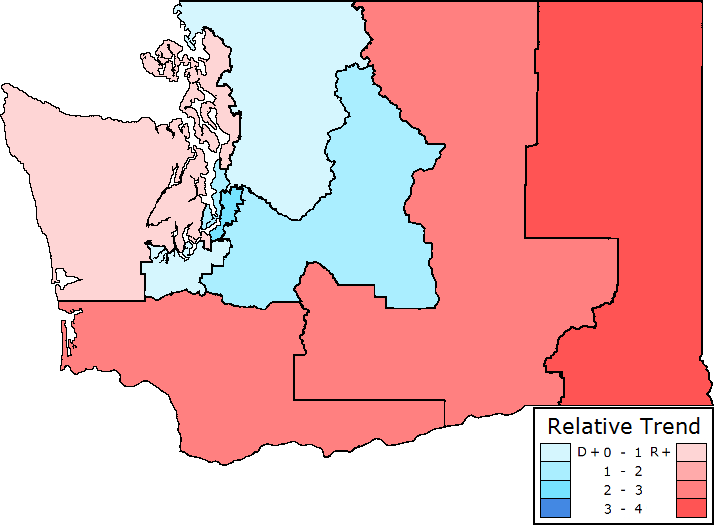
The trend was quite positive for Dems in the 8th but negative in the 3rd and this process should continue in 2016.
West Virginia
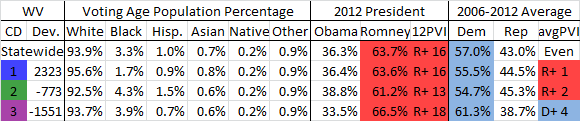

West Virginia more than any single state sees the widest divergence between presidential and downballot elections. Take a look at Obama's vote share and the average Dem performance and you'll see what I mean. There was a whopping 28 points difference in the 3rd, which sees the widest gap in the country. The reason for this is quite simple, West Virginia is a heavily unionized, conservative coal state. They vote for local Dems like Joe Manchin who support coal, but flee from the presidential ticket when Dems like Obama push policies such as cap and trade. Thus it is quite possible that we pick up the open 2nd district next year under this Dem drawn non-gerrymander, but by no means guaranteed as we'd need strong candidate.
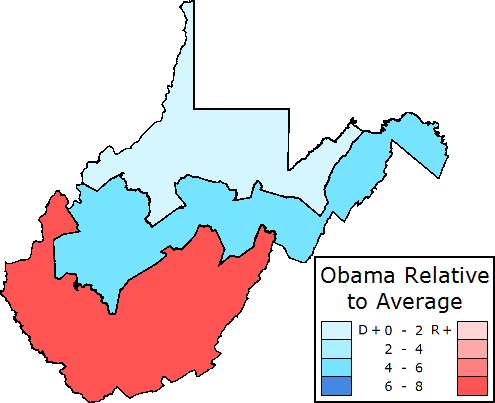
To reiterate, Obama underperforms tremendously in West Virginia, but he holds up a hell of a lot better in the more urban, suburban, and coal free 2nd district than he does in the 3rd which is the heart of coal country in the united states.
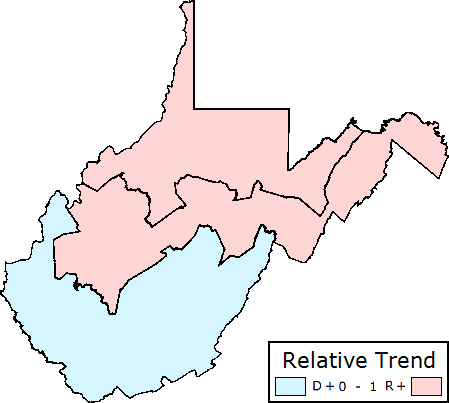
Overall West Virginia is trending somewhat Republican downballot, but don't let the presidential trend fool you. Even with the straight ticket voting option, Democrats still won 55% of the vote on average in 2012 while Obama won just 33% and they only lost a single race due to an ethically challenged incumbent, giving Republicans their first win since 2004. By district, the 3rd is surprisingly holding up the best while the 2nd is the worst. This is quite the opposite from neighboring heavily coal state Kentucky where the coal districts shifted strongly Republican and the urban ones the opposite.
Wisconsin
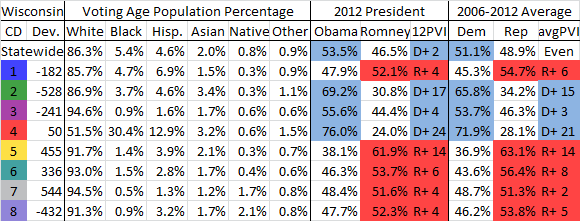
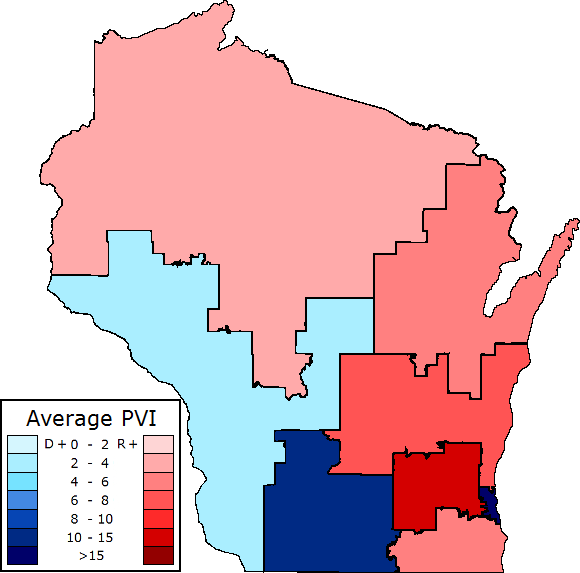
Our final state is Wisconsin where Republicans pushed through a gerrymander that left them with a majority of the seats in a state that voted majority Democratic. Dems are quite packed into the 2nd, 3rd, and 4th districts leaving the 1st, 6th, 7th, and 8th moderately Republican leaning. If we are to pick up a seat in the state it will be the 7th which is by far the least Republican of the 5. While Paul Ryan in the 1st is a tempting target, it will take millions upon millions of dollars to dislodge him and it is not worth the cost unless a self-funder runs.
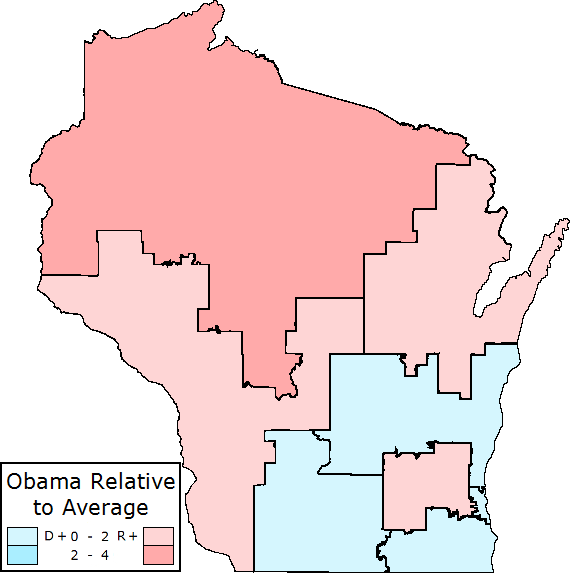
Obama performs in line with the average everywhere except the heavily rural northwoods based 7th.
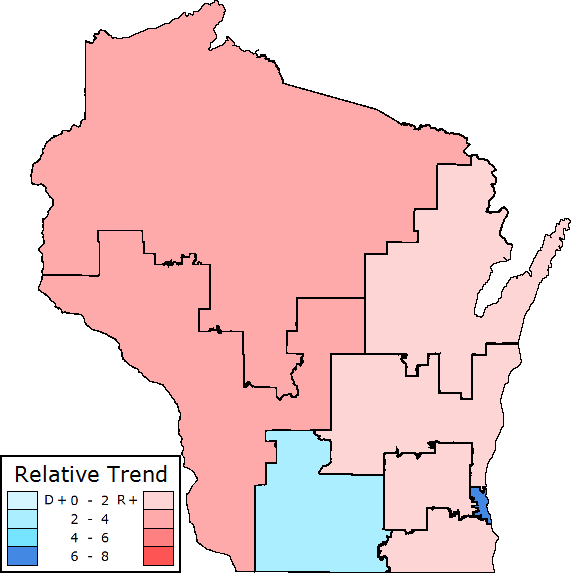
Dems took a beating in 2010 and while the state as a whole is fairly static, Dems held up much better in the Milwaukee based 4th and Madison based 2nd. The northwoods in particular led the 7th and 8th to trend Republican, while surprisingly the 3rd trended Republican despite its pro-Dem trend at the presidential level.
This concludes part 9 and I look forward to your comments below.

