I’ve been particularly interested in Pennsylvania recently. I’m not entirely sure why this is, but Pennsylvania is a very politically diverse state with its two most populous geographical areas trending in opposite directions, so it will probably remain a fascinating state for some time. I’ve drawn a Republican gerrymander and a nonpartisan map. Now it’s time to present my Democratic gerrymanders.
I have drawn three different Democratic gerrymanders of Pennsylvania. Some may have similar SEPAs or SWPAs, but all are distinct enough to be different. I’d like to know which of the three you think is the best.
So follow me over the fold to take a look at the maps!
This diary has been posted to DK Elections, an official Daily Kos sub-site. Please read the DKE Mission Statement. Our focus is on electoral politics rather than policy or preference. Welcome aboard!
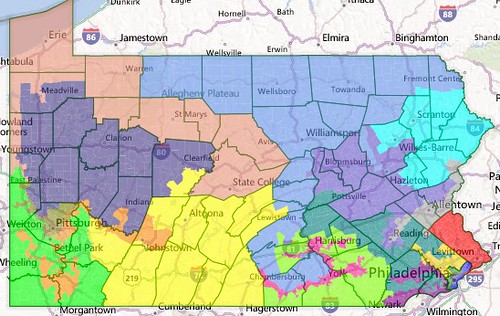
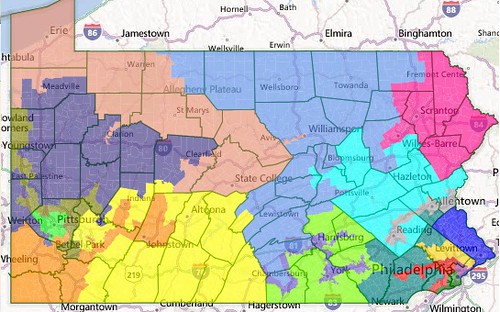
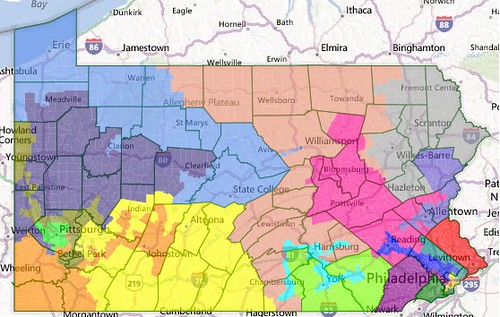
Democratic Gerrymander #1:
Map of the whole state:
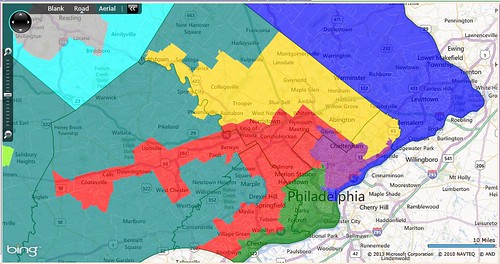
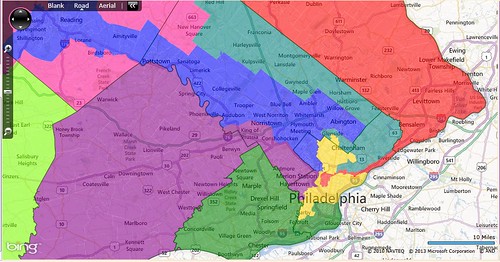
Map of SEPA:
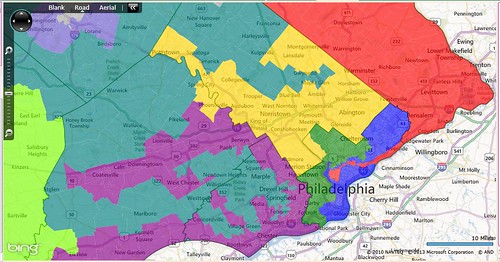
District 1 (blue): Bob Brady (D-Philadelphia)
Demographics: 62/15/14/7 (White/Black/Hispanic/Asian, all VAP)
Prez 2008: 71-28 Obama
Average: 73-27 Democratic
This district contains Northeast Philly, Center City, and parts of South Philly. Bob Brady would love this district. SAFE D.
District 2 (green): Chaka Fattah (D-Philadelphia)
Demographics: 19/65/7/6
Prez 2008: 94-6 Obama
Average: 92-8 Democratic
This district contains the African-American areas of Philadelphia. Like District 1, it is entirely within the city limits of Philadelphia. Chaka Fattah is one of the safest incumbents in the nation. SAFE D.
District 3 (purple): Joe Pitts (R-Kennett Square), Pat Meehan? (R-Drexel Hill)
Demographics: 73/17/5/5
Prez 2008: 63-37 Obama
Average: 58-42 Democratic
Although Joe Pitts may live in this district, he would never in a million years run here. I’m not sure if Meehan lives here, since Drexel Hill is split. However, one thing I am sure of is that neither would actually win this district. The district takes in the most Democratic areas of Chester and Delaware Counties, and either State Senators Andy Dinniman (D-West Whiteland Township) or Daylin Leach (D-Wayne [Radnor Township]) could run in this district. Whichever Democrat wins the primary will win the general election. SAFE D.
District 4 (red): Mike Fitzpatrick (R-Levittown)
Demographics: 81/10/4/3
Prez 2008: 58-41 Obama
Average: 56-44 Democratic
This district contains all of Bucks County, and then stretches a finger into North Philly to pick up some heavily African-American precincts there. Fitzpatrick is a strong incumbent, but with a good Democratic candidate I think we could win. Certainly if Fitzpatrick retires we would almost definitely pick up the seat. LEAN D with Fitzpatrick, LIKELY D if open.
District 5 (gold): Allyson Schwartz (D-Jenkintown)
Demographics: 80/9/4/6
Prez 2008: 63-36 Obama
Average: 59-41 Democratic
This district contains most of Montgomery County, as well as the East Falls neighborhood in Philadelphia and Phoenixville in Chester County. Schwartz is running for governor, but there are still many strong Democrats here such as Montgomery County Commissioner Josh Shapiro (D-Abington Township). Any Democrat could win this. SAFE D.
District 6 (teal): Jim Gerlach (R-West Pikeland Township), Pat Meehan? (R-Drexel Hill)
Demographics: 93/3/2/3
Prez 2008: 54-45 McCain
Average: 58-42 Republican
This district stretches from the suburbs of Philly all the way to the Susquehanna River. Pat Meehan might live here, since Drexel Hill is split, but he would probably lose a primary to Jim Gerlach. Gerlach, or any other Republican, would be safe here. SAFE R.
District 7 (gray): Charlie Dent (R-Allentown)
Demographics: 73/6/17/3
Prez 2008: 61-38 Obama
Average: 58-42 Democratic
This district has its base in Allentown and Bethlehem, and then goes northeast to take in Stroudsburg and west to take in Reading. The result is a strongly Democratic district that I don’t think Dent would be able to survive in. State Senator Lisa Boscola (D-Bethlehem Township) or Bethlehem Mayor John Callahan would be possible Democratic candidates. LIKELY D with Dent, SAFE D if open
District 8 (slate blue): Open Seat, but drawn for Tim Holden (D-St. Clair)
Demographics: 93/2/3/1
Prez 2008: 51-48 McCain
Average: 53-47 Republican
This district is drawn specifically for Tim Holden, and he’s the only Democrat who could hold it down. Holden would dramatically outperform the averages in not just Schuylkill but also Berks County, since Holden represented Berks in the 1990s. Holden is also the type of Democrat who can do well in Northumberland, Montour, and Columbia Counties. LIKELY D with Holden, LEAN R without.
District 9 (cyan): Matt Cartwright (D-Moosic)
Demographics: 89/4/5/1
Prez 2008: 57-42 Obama
Average: 55-45 Democratic
This district is an all-NEPA district based in Scranton and Wilkes-Barre. It loses Schuylkill County, and so becomes more compact. Cartwright is a good fit for this district. SAFE D.
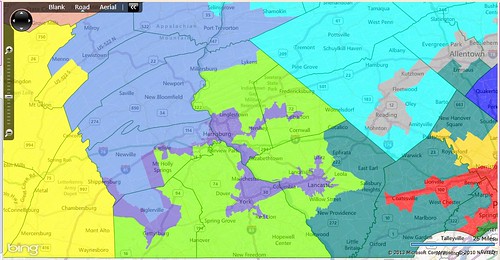
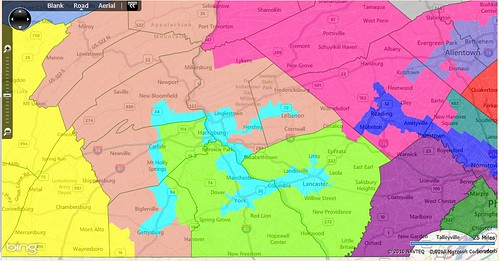
Map of central PA:
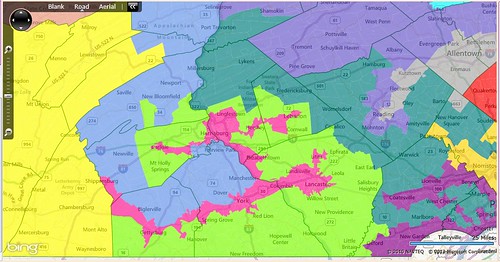
District 10 (pink): Open Seat
Demographics: 76/10/10/3
Prez 2008: 56-43 Obama
Average: 51-49 Republican
This is the one district that is basically the same on all of my maps. It is based in Harrisburg, Lancaster, and York, and is probably a swing seat since Obama overperformed here. State Senator Rob Teplitz (D-Susquehanna Township) or Auditor Eugene DePasquale (D-West Manchester Township) would be strong Democratic candidates here. LEAN D with Teplitz or DePasquale, TOSSUP Generic D vs. Generic R.
District 11 (yellow-green): Scott Perry (R-Carroll Township)
Demographics: 94/1/2/2
Prez 2008: 62-37 McCain
Average: 67-33 Republican
This district is based in Lancaster County and also includes substantial parts of Cumberland, Dauphin, Lebanon, York, and Adams Counties. Joe Pitts would probably run against Perry here, seeing as Pitts currently represents much of Lancaster County. The winner of the Republican primary would definitely win the general election. SAFE R.
District 12 (light blue): Tom Marino (R-Lycoming Township), Lou Barletta (R-Hazleton)
Demographics: 94/2/3/1
Prez 2008: 61-38 McCain
Average: 64-35 Republican
This district is based in the north and central regions of Pennsylvania, and is shaped like a T. It stretches from McKean to Susquehanna Counties in the north, and then goes all the way south to Adams and York Counties. The district has a finger into Luzerne County to pick up Hazleton, home of Lou Barletta. If Barletta were to run here, he would probably lose the primary to Marino. SAFE R.
District 13 (tan): Glenn “G.T.” Thompson (R-Bellefonte)
Demographics: 91/5/2/2
Prez 2008: 56-43 Obama
Average: 54-46 Democratic
This district is similar in all three maps, but there are some small but important differences. This version takes in Sharon and New Castle while others do not. Thompson would almost definitely lose here, and ex-Rep. Kathy Dahlkemper (D-Erie) or any Erie-based Democratic state legislator could win this district. LIKELY D.
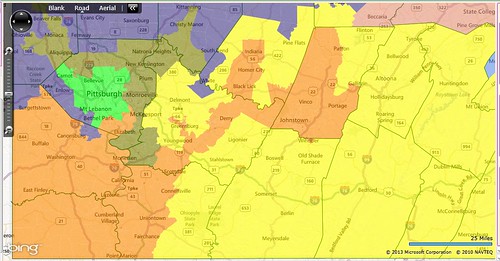
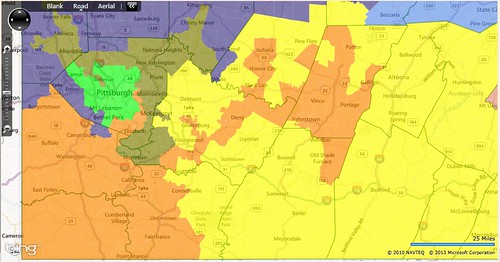
Map of SWPA:
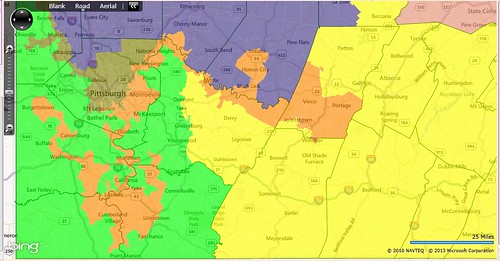
District 14 (olive): Mike Doyle (D-Forest Hills), Keith Rothfus (R-Sewickley)
Demographics: 81/13/2/3
Prez 2008: 62-37 Obama
Average: 64-36 Democratic
In what will be a recurring theme here, Doyle doesn’t actually live in this district but would run here, and Rothfus does live in this district but would not run here. Jason Altmire also lives here, but he is too conservative to win a primary here. This district contains the entirety of Pittsburgh and many of its suburbs, and Doyle would easily win here. SAFE D.
District 15 (orange): Open Seat, but drawn for Mark Critz (D-Johnstown)
Demographics: 86/11/1/1
Prez 2008: 58-41 Obama
Average: 62-37 Democratic
This weaving, winding district connects many of the Democratic areas of SWPA to form a seat that would be safe for ex-Rep. Mark Critz. The district is heavily gerrymandered because I wanted to ensure that it would elect a Democrat even in the worst years, since the area is trending away from us. SAFE D.
District 16 (light green): Tim Murphy (R-Upper St. Clair)
Demographics: 96/2/1/1
Prez 2008: 58-41 McCain
Average: 53-47 Republican
This district largely surrounds the southern extension of the 15th, and takes in all the Republican precincts of SWPA. Despite what the average may say, this district is quite Republican, and took a sharp rightward turn in 2012. Murphy is an entrenched incumbent and he would win easily here. SAFE R.
District 17 (dark blue): Mike Kelly (R-Butler)
Demographics: 97/1/1/1
Prez 2008: 61-37 McCain
Average: 60-40 Republican
Kelly’s district gets shifted to the south and east, and becomes much more Republican. Glenn Thompson might run here (or maybe in the 12th), but Kelly would probably beat him. Any Republican is completely safe here. SAFE R.
District 18 (yellow): Bill Shuster (R-Hollidaysburg)
Demographics: 95/2/2/1
Prez 2008: 63-36 McCain
Average: 62-38 Republican
The final Republican vote sink belong to Bill Shuster. It contains the eastern half of Westmoreland County, and then most of the areas east of it. These are some of the most Republican areas in the Northeast (though is this area really the Northeast?), and Shuster is completely safe. SAFE R.
Democratic Gerrymander #2:
Map of the whole state:
Map of SEPA:
District 1 (blue): Mike Fitzpatrick (R-Levittown)
Demographics: 86/5/4/4
Prez 2008: 56-43 Obama
This district is similar to the Bucks County district in my other maps, however it is slightly less Democratic because it takes in 80% Democratic, mostly-white precincts in downtown Philadelphia rather than 100% Democratic, mostly-black precincts in North Philly. This is to allow the creation of a second district that would probably elect an African-American. However, it means that Fitzpatrick could still win this district. TOSSUP with Fitzpatrick, LEAN D if open.
District 2 (green): Chaka Fattah (D-Philadelphia)
Demographics: 36/50/4/8
Prez 2008: 86-13 Obama
This district is similar to Brady’s current district, however I gave it to Fattah because the other Philly district, the 3rd, is not quite majority-black (but it is close). Fattah would be completely safe here. SAFE D.
District 3 (purple): Bob Brady? (D-Philadelphia)
Demographics: 28/46/18/5
Prez 2008: 88-12 Obama
I put a question mark next to Brady’s name because the demographics would seem to work against him here. A major goal of this map was to create two districts in Philadelphia that African-Americans could win, and if an African-American were to challenge Brady here in the primary the election could be close. However, any Democrat would be completely safe here. SAFE D.
District 4 (red): Pat Meehan (R-Drexel Hill)
Demographics: 85/6/3/5
Prez 2008: 60-39 Obama
Despite the fact that Pat Meehan lives here, he would almost definitely be defeated here, in this district that includes some moderate-to-liberal areas of Delaware County, some left-leaning areas of Chester County, and some solidly-liberal areas in Montgomery County and in Philadelphia. State Senators Andy Dinniman (D-West Whiteland Township) and Daylin Leach (D-Wayne [Radnor Township]) would be strong candidates here. LIKELY D with Meehan, SAFE D otherwise.
District 5 (gold): Allyson Schwartz (D-Jenkintown)
Demographics: 80/8/5/7
Prez 2008: 58-41 Obama
This district is based in Montgomery County, and includes some of Northeast Philly. Although the Presidential numbers may look low (after all, Gerlach’s district in the 2000s voted 58% for Obama also), there is a lot of downballot Democratic strength in Northeast Philly, and the Montgomery County Democratic Party is considerably stronger and more successful than those of Delaware and Chester Counties. Someone like Montgomery County Commissioner Josh Shapiro (D-Abington Township) could easily win here. LIKELY D.
District 6 (teal): Jim Gerlach (R-West Pikeland Township), Joe Pitts (R-Kennett Square)
Demographics: 91/3/4/3
Prez 2008: 53-46 McCain
This district contains the most Republican parts of the Philly suburbs, as well as a substantial chunk of Lancaster County. Joe Pitts doesn’t really have any good options under this map, since Lancaster County is split into three approximately equal chunks, where one has more of York County, one leans Democratic, and this district is the third. Pitts would probably lose a primary here to Gerlach, who is a better fit for the Philly suburbs here. Any Republican would be safe here, though. SAFE R.
District 7 (gray): Charlie Dent (R-Allentown)
Demographics: 74/5/18/2
Prez 2008: 61-38 Obama
This district contains the most Democratic parts of Lehigh and Northampton Counties, and then goes into Berks County to pick up the Reading area. This is really the classic way to get rid of Charlie Dent, and I really don’t see how he would survive here. State Senators Lisa Boscola (D-Bethlehem Township) or Judy Schwank (D-Fleetwood) or Bethlehem mayor John Callahan would be strong candidates for the Democrats. LEAN D Dent vs. Generic D, LIKELY D Dent vs. a top-tier Democrat, SAFE D if the Republican candidate is not Dent.
Map of central PA:
District 8 (slate blue): Open Seat
Demographics: 76/11/10/3
Prez 2008: 56-43 Obama
This is the same Lancaster/York/Harrisburg district that I have on all of my maps. Obama overperformed here, so this seat would be relatively swingy. State Senator Rob Teplitz (D-Susquehanna Township) or Auditor Eugene DePasquale (D-West Manchester Township) would be strong candidates for the Democrats. Either would be slightly favored. LEAN D.
District 9 (cyan): Open Seat, but drawn for Tim Holden (D-St. Clair)
Demographics: 95/2/2/1
Prez 2008: 52-46 McCain
All three of my maps have a district that is specifically drawn for Tim Holden, and this is it. Holden runs particularly strong with rural, working-class voters, and this district has many of them. The only Democrat that could hold this district is Holden, and it would be hard for a Republican to defeat him if he were to run. LIKELY D with Holden, LIKELY R without Holden.
District 10 (pink): Matt Cartwright (D-Moosic)
Demographics: 88/5/5/1
Prez 2008: 58-41 Obama
This is a compact, NEPA-based district that would be safe for Cartwright. This is the most Democratic version of Cartwright’s district in any of my three maps here. Especially with the addition of most of Monroe County, the district is SAFE D.
District 11 (yellow-green): Scott Perry (R-Carroll Township)
Demographics: 95/1/2/1
Prez 2008: 62-37 McCain
This district takes in the rural, conservative areas of south-central Pennsylvania, including the areas around Harrisburg, Lancaster, and York. Perry lives here and would probably win the primary, and if so he would definitely win the general election. This Republican vote sink would always elect Republicans. SAFE R.
District 12 (light blue): Tom Marino (R-Lycoming Township), Lou Barletta (R-Hazleton)
Demographics: 95/1/3/1
Prez 2008: 62-37 McCain
This district takes in Pennsylvania’s Northern Tier and then extends south to take in some heavily Republican areas of central Pennsylvania. The district is more Marino’s than Barletta’s, so Marino would probably win a Republican primary, however Barletta’s anti-Hispanic nonsense would probably play well here, so Marino may have to watch his back. Either way, any Republican would easily win this. SAFE R.
Map of SWPA:
The districts of Western Pennsylvania on this map are very similar to those of map #3, so I’m only going to give small descriptions here, as well as demographic and partisan data, since I don’t feel like writing basically the same thing twice.
District 13 (tan): Glenn “G.T.” Thompson (R-Bellefonte)
Demographics: 90/5/2/2
Prez 2008: 55-44 Obama
District 14 (olive): Open Seat, but drawn for Jason Altmire (D-McCandless)
Demographics: 88/9/1/1
Prez 2008: 53-46 Obama
District 15 (orange): Open Seat, but drawn for Mark Critz (D-Johnstown)
Demographics: 93/5/1/1
Prez 2008: 50-48 Obama
These two seats (Districts 14 and 15) have only small differences with map #3. Mainly, in map #3 District 15 stretches north from Duquesne to grab Braddock, Swissvale, and Wilkinsburg, which makes it slightly more Democratic than the version in map #2. District 14 is similarly slightly more Democratic in map #2 than in map #3. However, I think that Critz and Altmire would be able to win the districts either way. LIKELY D for both districts if Critz and Altmire run, LEAN D for both districts if they do not run.
District 16 (light green): Mike Doyle (D-Forest Hills), Keith Rothfus (R-Sewickley)
Demographics: 82/12/2/3
Prez 2008: 62-38 Obama
This district is unremarkable. Although Doyle doesn’t live here, he would run here and win here.
SAFE D.
District 17 (dark blue): Tim Murphy (R-Upper St. Clair), Mike Kelly (R-Butler)
Demographics: 97/1/1/1
Prez 2008: 62-37 McCain
District 18 (yellow): Bill Shuster (R-Hollidaysburg)
Demographics: 96/2/1/1
Prez 2008: 64-35 McCain
These two districts are the two Republican vote sinks of Western Pennsylvania. District 17 would face a competitive primary between Murphy and Kelly, and possibly Thompson as well. District 18 would be an easy primary win by Shuster. Both districts would be SAFE R in the general election.
Democratic Gerrymander #3:
Map of the whole state:
Map of SEPA:
District 1 (blue): Allyson Schwartz (D-Jenkintown)
Demographics: 77/9/10/4
Prez 2008: 62-37 Obama
Average: 58-42 Democratic
This district stretches from Philadelphia’s East Falls neighborhood to Reading, taking in several Democratic suburban areas such as Abington, Norristown, and Pottstown. Although Schwartz is running for Governor, there are plenty of Democrats who could run here, including Montgomery County Commissioner Josh Shapiro (D-Abington Township). Republicans couldn’t win here even in a year like 2010. SAFE D.
District 2 (green): Pat Meehan (R-Drexel Hill)
Demographics: 69/19/4/6
Prez 2008: 63-36 Obama
Average: 61-39 Democratic
This district contains the entirety of Delaware County, as well as most of South Philadelphia. Although Meehan lives here, he would be destroyed if he were to run in this district. The most obvious Democratic candidate here, Joe Sestak, is running for Senate in 2016, so the Democratic field would be wide open. A possible candidate would be State Senator Daylin Leach (D-Wayne [Radnor Township]), who is currently running for Schwartz’s seat. Whichever Democrat is the nominee would easily win this seat. SAFE D.
District 3 (purple): Jim Gerlach (R-West Pikeland Township), Joe Pitts (R-Kennett Square)
Demographics: 72/18/5/4
Prez 2008: 63-36 Obama
Average: 59-41 Democratic
This district contains the entirety of Chester County, and then Upper and Lower Merion in Montgomery County, and a heavily Democratic slice of West Philadelphia. In order for a Republican to win this district, they would have to win Chester County by more than 50,000 votes, and I don’t think even Jim Gerlach could do that. Joe Pitts would probably run in the 11th, which contains most of Lancaster County. The obvious Democratic candidate here is State Senator Andy Dinniman (D-West Whiteland Township), who would easily defeat Gerlach. LIKELY D with Gerlach, SAFE D without him.
District 4 (red): Mike Fitzpatrick (R-Levittown)
Demographics: 80/11/4/3
Prez 2008: 58-41 Obama
Average: 56-44 Democratic
This district contains the entirety of Bucks County, and then sends a finger into North Philly to pick up a heavily-Democratic, mostly African-American area there. Fitzpatrick is a strong incumbent, but with a good Democratic candidate I think we could win. Certainly if Fitzpatrick retires we would almost definitely pick up the seat. LEAN D with Fitzpatrick, LIKELY D if open.
District 5 (gold): Chaka Fattah (D-Philadelphia)
Demographics: 31/50/11/6
Prez 2008: 92-8 Obama
Average: 90-10 Democratic
Evan after the 2nd, 3rd, and 4th all picked up some African-American areas in Philadelphia, it was still possible to draw a majority-African-American district, and this is it. Chaka Fattah would have no problems here. SAFE D.
District 6 (teal): Bob Brady? (D-Philadelphia)
Demographics: 70/11/10/8
Prez 2008: 61-38 Obama
Average: 60-40 Democratic
This district is a mix of Philadelphia and its suburbs, containing 425,000 people from Philadelphia and 280,000 people from the suburbs. This district contains the second-largest slice of Philadelphia after the 5th, and so Bob Brady might want to run here. Brady is the kind of big-city politician who would not do well in the suburbs, but the suburbs voted 56% for Obama in 2008, and even if Brady lost the suburbs he would still win the Philly portions easily, especially considering that he is strong in Northeast Philly. I think he could beat any Republican here. LIKELY D Brady vs. an incumbent Republican state legislator, SAFE D otherwise.
District 7 (gray): Matt Cartwright (D-Moosic)
Demographics: 92/3/3/1
Prez 2008: 55-44 Obama
Average: 54-46 Democratic
This district is slightly less Democratic than Cartwright’s current district, but it is more confined to NEPA and pulls out of Schuylkill County. Considering that Lackawanna County actually swung toward Obama in 2012, I don’t think Cartwright has anything to worry about. LIKELY D Cartwright vs. an incumbent Republican state legislator, SAFE D otherwise.
District 8 (slate blue): Charlie Dent (R-Allentown)
Demographics: 77/6/13/3
Prez 2008: 59-40 Obama
Average: 56-44 Democratic
This district contains most of the Lehigh Valley, and then picks up most of fast-growing and Democratic-trending Monroe County. Charlie Dent survived pretty well in his 56% Obama district in the 2000s, but this district loses the Republican northern areas of Lehigh and Northampton Counties, and voters in Monroe County don’t know Dent. State Senator Lisa Boscola (D-Bethlehem Township) or Bethlehem Mayor John Callahan would be possible Democratic candidates. LEAN D.
Map of central PA:
District 9 (cyan): Open Seat
Demographics: 76/11/10/3
Prez 2008: 55-44 Obama
Average: 51-49 Republican
This district is based in the three cities of Harrisburg, Lancaster, and York, and also contains the smaller cities of Lebanon, Carlisle, and Gettysburg. Obama overperformed here in 2008, so this would probably be a swing seat. The Democrats’ best candidates would be State Senator Rob Teplitz (D-Susquehanna Township) and State Auditor Eugene DePasquale (D-West Manchester Township). LEAN D with Teplitz or DePasquale, TOSSUP Generic D vs. Generic R.
District 10 (pink): Open Seat, but drawn for Tim Holden (D-St. Clair)
Demographics: 94/2/3/1
Prez 2008: 54-45 McCain
Average: 56-44 Republican
This district, at first glance, looks pretty Republican, however I drew it for Tim Holden, and Holden is the only Democrat who could win here. Holden would dramatically outperform the average in not only Schuylkill County but Berks County as well, since he represented all of Berks County in the 1990s. Also, Holden is the kind of Democrat who can do well in Northumberland, Montour, and Columbia Counties. This district does contain part of Hazleton, Lou Barletta’s hometown, but the parts it contains are the more Hispanic parts, and since Barletta is an anti-Hispanic nutcase, I assume that he would live in the whiter part of town; however if he doesn’t that should be easy to fix. LIKELY D with Holden, LIKELY R otherwise.
District 11 (yellow-green): Scott Perry (R-Carroll Township)
Demographics: 94/1/2/1
Prez 2008: 63-36 McCain
Average: 68-32 Republican
This heavily Republican district contains suburban and rural areas of Lancaster, York, and Cumberland Counties. The only incumbent who lives here is Scott Perry, however Joe Pitts would probably run here as well since he has represented Lancaster County for a while. Whichever Republican wins the primary will be safe in the general election. SAFE R.
District 12 (light blue): Glenn “G.T.” Thompson (R-Bellefonte)
Demographics: 90/5/2/2
Prez 2008: 55-44 Obama
Average: 52-48 Democratic
This is a bipolar district, with State College on one side, Erie on the other, and not a heck of a lot in the middle. Thompson is a right-wing backbencher, and would probably lose to someone like former Representative Kathy Dahlkemper (D-Erie) or any of Erie’s Democratic state legislators. Thompson’s other options would be to run in either the 13th or the 17th, but he would face competitive primaries in both districts. LEAN D.
District 13 (tan): Tom Marino (R-Lycoming Township), Lou Barletta (R-Hazleton)
Demographics: 95/1/2/1
Prez 2008: 63-36 McCain
Average: 66-34 Republican
This heavily Republican district is mostly rural and shaped almost like a T, taking in lots of strongly Republican areas in central Pennsylvania. Lou Barletta might run here, but he would probably lose to Tom Marino in the primary. The winner of the Republican primary is completely safe here. SAFE R.
Map of SWPA:
District 14 (olive): Open Seat, but drawn for Jason Altmire (D-McCandless)
Demographics: 90/7/1/1
Prez 2008: 52-47 Obama
Average: 56-44 Democratic
This district includes the Sharon area, then the Mahoning and Ohio Valleys, then takes in some northern and eastern Pittsburgh suburbs, and then goes east to Vandergrift and south to Monessen. Unlike the district that Altmire used to represent, this district actually voted for Obama, and so Altmire should have no problem here. LIKELY D with Altmire, LEAN D if open.
District 15 (orange): Open Seat, but drawn for Mark Critz (D-Johnstown)
Demographics: 90/7/1/1
Prez 2008: 53-46 Obama
Average: 58-42 Democratic
This district contains large areas of Southwestern Pennsylvania, including all of Greene County, most of Washington, majorities of Fayette and Cambria, and parts of Allegheny, Westmoreland, Indiana, and Somerset. This area is still locally Democratic, as shown by its average being significantly higher than Obama’s performance. Mark Critz would have no trouble here. LIKELY D with Critz, LEAN D otherwise.
District 16 (light green): Mike Doyle (D-Forest Hills), Keith Rothfus (R-Sewickley)
Demographics: 82/12/2/3
Prez 2008: 61-38 Obama
Average: 63-37 Democratic
This district contains all of Pittsburgh and most of its inner suburbs. Mike Doyle doesn’t actually live in this district (he lives in the 14th), but he would definitely run here. Rothfus, on the other hand, although he does live here, would definitely not run here. SAFE D.
District 17 (dark blue): Tim Murphy (R-Upper St. Clair), Mike Kelly (R-Butler)
Demographics: 97/1/1/1 (I think this is the whitest district I’ve ever drawn)
Prez 2008: 62-37 McCain
Average: 61-38 Republican
This district uses touch-point contiguity over the Mahoning River to connect Peters and Upper St. Clair Townships to Butler County and the surrounding area. Mike Kelly would probably defeat Tim Murphy in a primary here, since Kelly has more territory here than Murphy. Either way, this is another Republican vote sink. SAFE R.
District 18 (yellow): Bill Shuster (R-Hollidaysburg)
Demographics: 96/2/1/1
Prez 2008: 64-35 McCain
Average: 63-37 Republican
This district is the final Republican vote sink, taking in suburban Westmoreland County and going out to Blair, Huntingdon, and Franklin Counties. Shuster is completely safe here. SAFE R.
So there you have it. Three possible Democratic gerrymanders of Pennsylvania that would each net us at least six, and possibly up to nine, new Democrats from Pennsylvania. I am curious as to which map you think is the best. I would appreciate explanations and rationales, as this would help me in my quest to draw the perfect Democratic gerrymander.
I hope you enjoyed reading this diary, and I look forward to reading your opinions in the comments.

