Vulcans are an extraterrestrial humanoid species in the Star Trek universe who evolved on the planet Vulcan. They are also noted for their attempt to live by reason and logic with no interference from emotion. [...]
Vulcan is also the name for the Project which attempts to scientifically measure and model
the Carbon Dioxide sources and sinks in the Biosphere, otherwise known as the surface of Earth.
[See the Presentation given at Google TechTalk on the Vulcan Project, after the intro block.]
'Revolutionary' CO2 maps zoom in on greenhouse gas sources -- Purdue University
link to video
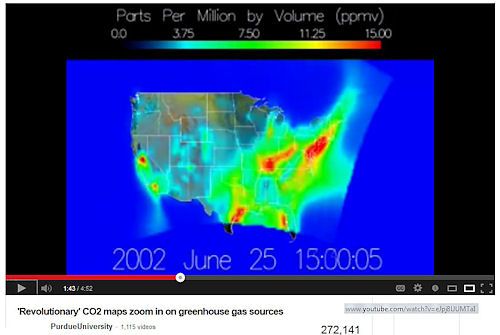
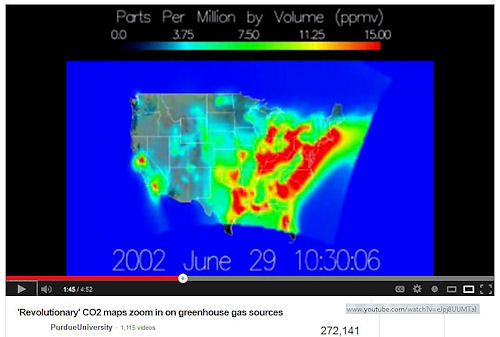
A new, high resolution, interactive map of United States carbon dioxide emissions from fossil fuels has found that the emissions aren't all where we thought. The maps and system, called Vulcan, show CO2 emissions at more than 100 times more detail than was available before. Until now, data on carbon dioxide emissions were reported, in the best cases, monthly at the level of an entire state grid. The Vulcan model examines CO2 emissions at local levels on an hourly basis. Purdue researchers say the maps are also more accurate than previous data because they are based on greenhouse gas emissions instead of estimates based on population in areas of the United States.
Here are 2 CO2 Hot Spot snapshots, about 4 days apart:
(some might call this "CO2 weather.")
larger
larger
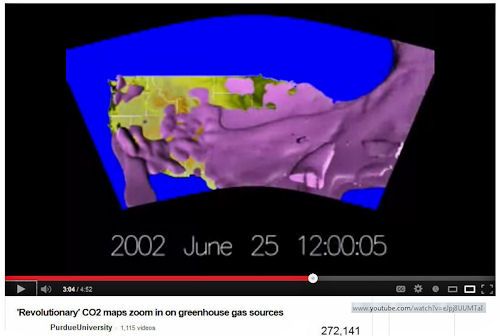
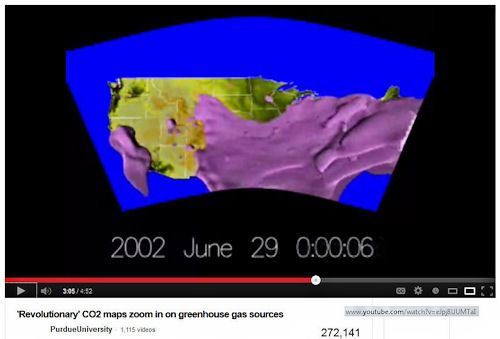
Here are the 3d views of those same CO2 Hot Spots, again about 4 days apart:
larger
larger
About Project Vulcan
The Vulcan Project is a NASA/DOE funded effort under the North American Carbon Program (NACP) to quantify North American fossil fuel carbon dioxide (CO2) emissions at space and time scales much finer than has been achieved in the past. The purpose is to aid in quantification of the North American carbon budget, to support inverse estimation of carbon sources and sinks, and to support the demands posed by higher resolution CO2 observations (in situ and remotely sensed). The detail and scope of the Vulcan CO2 inventory has also made it a valuable tool for policymakers, demographers, social scientists and the public at large (now on Google Earth!). Here is a narrated flyover.
The Vulcan project has achieved the quantification of the 2002 U.S. fossil fuel CO2 emissions at the scale of individual factories, powerplants, roadways and neighborhoods on an hourly basis. We have built the entire inventory on a common 10 km x 10 km grid to facilitate atmospheric modeling. In addition to improvement in space and time resolution, Vulcan is quantified at the level of fuel type, economic sub-sector, and county/state identification.
Project Vulcan -- wikipedia.org
The detail and scope of the Vulcan CO2 inventory has now made it a valuable tool for policymakers, demographers, social scientists and the public at large.[...]
As Spock might say:
"It's only logical ..."
Data is meant to be read. If it can be read "visually" all the better.
Carbon dioxide emissions map released on Google Earth -- Purdue University
link to video
Here's a Google Map preview for how to read and use the Vulcan CO2 data.
Here's how to get the Vulcan CO2 data into your own Google Earth layer. (KML)
And if you have some time to invest, Dr Kevin Gurney from Purdue University, discussed the Vulcan Project and the importance of its data monitoring and collection efforts, for the advancement of Climate Science, with an emphasis on real-world Environmental management, at Google Tech Talks:
How to Count ALL Human Carbon Emissions in the US -- Google Tech Talks
link to video
The Vulcan Project has estimated US fossil fuel CO2 emissions at the scale of individual factories, powerplants, roadways and cities. It has placed the inventory on a common 10 km x10 km grid at the hourly timescale for the year 2002. In addition to improvement in space and time resolution, Vulcan is quantified at the level of fuel type, economic sub-sector, and county/state identification. Vulcan is now estimating other years and including Canada and Mexico in its spatial domain.
 larger
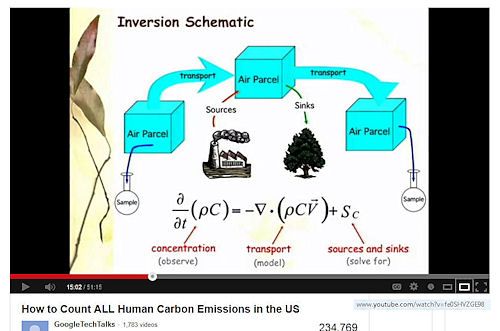
[The formula for solving for the Carbon Dioxide sources and sinks in our Biosphere.]
Dr Kevin Gurney in that presentation, was pinning his hopes on getting an important forecasting handle on the sources and sinks cycles of CO2, on the launch of NASA's Orbital Carbon Observatory. [Timemark 16:40]
Orbital Carbon Observatory
OCO's measurements would have been accurate enough to show for the first time the geographic distribution of carbon dioxide sources and sinks on a regional scale.[6] The data would have improved the understanding of the global carbon cycle, the natural processes and human activities that influence the abundance and distribution of the greenhouse gas. This improved understanding was expected to enable more reliable forecasts of future changes in the abundance and distribution of carbon dioxide in the atmosphere and the effect that these changes may have on Earth's climate.
Too bad however, the
Orbital Carbon Observatory had some technical challenges of its own --
much to the detriment of us all -- especially data-oriented Climate Scientists,
who need real-time data.
NASA Releases Orbiting Carbon Observatory Accident Summary
July 17, 2009
WASHINGTON -- A NASA panel that investigated the unsuccessful Feb. 24 launch of the Orbiting Carbon Observatory, or OCO, has completed its report.
NASA's OCO satellite to study atmospheric carbon dioxide launched aboard a Taurus XL rocket from Vandenberg Air Force Base in California on Feb. 24 at 4:55 a.m. EST, but it failed to reach orbit.
[...]
And so it goes ...
The long march of Science is often hampered by, 'what might have been.'
Mapping and measuring CO2 data is the first step to better understanding and managing this critical real world phenomena -- one that is impacting us more and more, as each year passes.
May we live long and prosper, by it -- the pursuit and capture of CO2 data.
Assuming we still care enough to go where satellite-funders, still fear to tread.

link
So to avoid appearing self-serving, I'll simply say to the Science-Agnostics, who would cling to past: "Good Luck."

