The Virginia State Senate has been in the news a lot recently. This is not only due to the fact that it is currently tied 20-20 between Democrats and Republicans, and that Ralph Northam’s victory in the Lieutenant Gubernatorial election will allow the Democrats to take back control of the State Senate. It is also about the fact that there will be two special elections to the State Senate in the near future, and if we lose even one seat the Republicans will take control.
Thus, I have been wondering for a while what kind of map we could draw if Democrats were in charge of redistricting the State Senate. How big of a majority would we be able to draw ourselves if we had control? That was the question I set out to answer when I drew this map, and it turns out that the Democrats could draw a pretty large majority here. We wouldn’t have to worry about conservadems or one or two Democrats voting with the Republicans; we’d still have a solid majority.
How do I draw a map that accomplishes this? I present my map over the fold.
This diary is posted to Daily Kos Elections, an official Daily Kos subsite. Please read the DKE Mission Statement. Our focus is on electoral politics rather than policy or preference. Welcome aboard!
Here is the map:
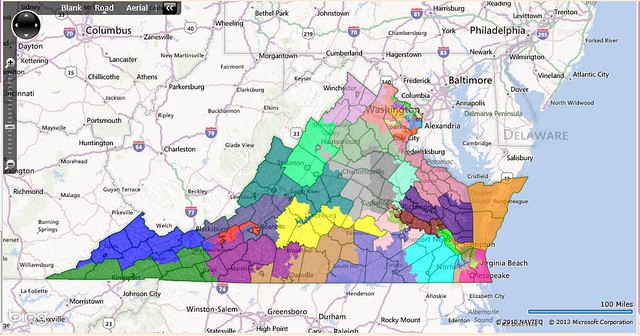
District 1 (blue): Phillip Puckett (D-Russell County)
Demographics: 95/3/1/0 (white/black/Hispanic/Asian, all in VAP)
Prez ’08: 59-39 McCain
Average: 54-46 Republican
This is a true conservadem seat in Southwestern Virginia. This area is rapidly trending away from the Democrats (Romney probably got over 65% here in 2012), but we still have a state senator here, Phillip Puckett. Puckett won re-election here 53-47 in 2011, and once Puckett retires a Republican is almost certainly going to succeed him. LEAN D with Puckett, LIKELY R otherwise.
District 2 (green): Charles “Bill” Carrico (R-Galax)
Demographics: 95/2/2/0
Prez ’08: 66-33 McCain
Average: 63-37 Republican
This is another SW Virginia seat, and it is strongly Republican up and down the ballot. Carrico is strongly conservative, but is nonetheless a good match for the seat. SAFE R.
District 3 (purple): Bill Stanley (R-Franklin County)
Demographics: 89/8/2/0
Prez ’08: 63-36 McCain
Average: 62-38 Republican
Stanley defeated a Democratic incumbent in 2011 in a seat that was more Democratic than this one (but still leaned Republican) and was more centered in the Southside. His district moves west and becomes substantially more Republican. He loses Danville and Martinsville, and picks up portions of Carroll, Pulaski, and Montgomery Counties. SAFE R.
District 4 (red): John S. Edwards (D-Roanoke)
Demographics: 76/15/4/4
Prez ’08: 57-42 Obama
Average: 55-45 Democratic
Edwards keeps a district that is very similar to his current one, based in Roanoke and Blacksburg. He gains Democratic-leaning Radford and loses bright-red Giles County, but the overall idea of the district is the same. He won 56 percent in 2011, a terrible year for Virginia Dems, so he should be safe. SAFE D.
District 5 (tan/dark yellow): Open
Demographics: 62/35/2/1
Prez ’08: 52-47 Obama
Average: 51-49 Republican
This is a new swing district based in Virginia’s Southside. It was drawn for Roscoe Reynolds, a moderate Democrat from Martinsville who used to represent the western half of this district before he was defeated in 2011. However, his old district voted for McCain by a wide margin while this one voted for Obama, so he should be able to do better here. It is a possibility that Frank Ruff, a Republican whose Mecklenburg County home was put in an African-American-majority district, might try to run here, but even if he did, the race would be close. LEAN D if Reynolds runs but not Ruff, LEAN R if Ruff runs but not Reynolds, TOSSUP if both or neither run.
District 6 (teal): Creigh Deeds (D-Bath County)
Demographics: 76/17/3/3
Prez ’08: 56-43 Obama
Average: 54-46 Democratic
This district is a modified version of Deeds’ current district. It keeps most of Albemarle but loses Charlottesville, and picks up the Democratic parts of Lynchburg and Buckingham County. He also loses half of Republican Rockbridge County. The result is a district that is still Democratic, and with Deeds’ strength in the three westernmost counties, he’ll win easily. SAFE D.
District 7 (gray): Mark Obenshain (R-Harrisonburg)
Demographics: 76/13/5/3
Prez ’08: 57-42 Obama
Average: 53-47 Democratic
Although I said that Obenshain lives here, there is no way that he would even consider running here. Although I did not have messing with Obenshain as a goal when making this map, that’s exactly what this map does. This district is based in Charlottesville and contains the most Democratic parts of nearby counties in central Virginia, and then stretches an arm into Rockingham County to pick up Harrisonburg. Former state senator Edd Houck used to represent some of this area, but he’s from the Fredericksburg area so he wouldn’t run here. However, any Democrat who runs here would be strongly favored. LIKELY D.
District 8 (slate blue): Frank Ruff (R-Clarksville)
Demographics: 45/50/3/1
Prez ’08: 63-37 Obama
Average: 57-43 Democratic
Frank Ruff may live here, but there’s no way that he’d run in this African-American-majority district. However, interestingly enough, no Democratic incumbents live here, as Louise Lucas lives in Portsmouth and Henry Marsh lives in Richmond. However, a Democrat, possibly from Petersburg, is certain to win the general election here. SAFE D.
District 9 (cyan): Louise Lucas (D-Portsmouth)
Demographics: 53/42/2/1
Prez ’08: 57-42 Obama
Average: 53-47 Democratic
This district is located just east of the 8th and contains parts of Sussex and Southampton, all of Surry, Isle of Wight, and Suffolk, and part of Portsmouth. While it’s not as Democratic as Lucas’ current district, I assumed that Kenny Alexander would run in the 12th (which is Lucas’ other option). This district is not only 42 percent black but is trending Democratic, so Lucas, or whichever Democrat runs here, should be safe. SAFE D.
District 10 (pink): Jeff McWaters (R-Virginia Beach), John Cosgrove (R-Chesapeake)
Demographics: 82/10/4/3
Prez ’08: 63-37 McCain
Average: 63-37 Republican
Amazing as it is, this is the only Republican district in the seven Hampton Roads cities under this map. Thus, there will probably be a hard-fought Republican primary here, which may become a battle between Virginia Beach and Chesapeake. However, the general election will probably be a snoozefest. SAFE R.
District 11 (chartreuse): Frank Wagner (R-Virginia Beach)
Demographics: 58/25/7/7
Prez ’08: 58-41 Obama
Average: 52-48 Democratic
This is a Democratic district located entirely in Virginia Beach. If Wagner runs here, he would face very long odds of getting re-elected. It’s about time the Dems got a state senate district in VB, which is almost 50-50 now. LIKELY D.
District 12 (cornflower blue): Kenny Alexander (D-Norfolk)
Demographics: 41/52/3/2
Prez ’08: 70-29 Obama
Average: 65-35 Democratic
This is a majority-African-American district located in Norfolk, Chesapeake, and Portsmouth. It is cleverly drawn so that it takes in some of the more conservative areas of western Chesapeake so as to allow for the creation of the 13th district. This district is still safe for any African-American Democrat. SAFE D.
District 13 (dark salmon): Open
Demographics: 54/32/5/7
Prez ’08: 57-42 Obama
Average: 53-47 Democratic
This is one of my favorite districts on the map. It includes a Democratic-leaning slice of Chesapeake, some Republican-leaning areas of VB, and some strongly Democratic areas of Norfolk. The end result is a district that Democrats are very likely to win, and, at almost a third African-American, this would be a good opportunity for an African-American politician as well. LIKELY D.
District 14 (olive): Open
Demographics: 64/24/6/4
Prez ’08: 58-42 Obama
Average: 54-46 Democratic
This district takes in areas of Norfolk and VB that are mostly represented by Ralph Northam now (however, it does not include the Eastern Shore), and then it includes a small chunk of Hampton to get it up to the correct population. The probable senator for this district is a white Norfolk Democrat who is a little bit to the left of Northam. However, we’d probably win this regardless of who the Democrat is. SAFE D.
District 15 (dark orange): Mamie Locke (D-Hampton)
Demographics: 51/38/5/3
Prez ’08: 62-38 Obama
Average: 57-43 Democratic
This district contains the Eastern Shore (Accomack and Northampton), the remainder of Hampton, and parts of Newport News and York. This district is completely safe for Locke. SAFE D.
District 16 (lime green): John Miller (D-Newport News)
Demographics: 55/33/6/3
Prez ’08: 62-37 Obama
Average: 56-44 Democratic
This district contains the remainder of Newport News, as well as Democratic-leaning parts of York and James City Counties, and all of Williamsburg. Miller has had some close races in the past, and so he’d probably appreciate that this district is a few points more Democratic than his current district. I don’t see how a Republican can win a 62% Obama district here. SAFE D.
District 17 (dark slate blue): Ralph K. Smith (R-Botetourt County)
Demographics: 93/4/1/1
Prez ’08: 61-38 McCain
Average: 60-40 Republican
We now move back to the Roanoke area with this heavily Republican district consisting mostly of suburbs of Roanoke. Smith is from deep-red Botetourt County, and he is completely safe here. SAFE R.
District 18 (yellow): Steve Newman (R-Forest)
Demographics: 81/15/2/1
Prez ’08: 66-33 McCain
Average: 65-35 Democratic
This district includes the Lynchburg area and then extends east to include Amelia County. Newman is from even-deeper-red Bedford County, and there is no way he gets even close to losing. SAFE R.
District 19 (yellow-green): John Watkins (R-Midlothian)
Demographics: 60/27/9/3
Prez ’08: 55-44 Obama
Average: 51-49 Republican
This district contains a small slice of Richmond and the most Democratic areas of Chesterfield County. This area is trending Democratic as more African-Americans move to the suburbs. I’m not entirely sure if Watkins lives here or not; Midlothian straddles the border between the 19th and the 20th. He won only 56 percent of the vote in 2011, and he loses all of deep-red Powhatan County, so even if he were to run here it would be no worse than a toss-up for us. But as this district moves to the left, Watkins would be hard-pressed to survive. TOSSUP initially if Watkins runs here, LEAN D initially if open, LIKELY D by the end of the decade.
District 20 (pink): Steve Martin (R-Chesterfield County)
Demographics: 83/10/2/3
Prez ’08: 65-34 McCain
Average: 68-32 Republican
This is a heavily Republican district south of Richmond that takes the most Republican areas of Prince George, Dinwiddie, and Chesterfield, and then takes in adjoining Republican areas of Powhatan and Henrico. The Prince George part of the district is connected to the rest only by water contiguity, but that is generally not an issue in Virginia. Any Republican with a pulse could easily win here. SAFE R.
District 21 (maroon): Henry Marsh (D-Richmond), Tommy Norment (R-James City County)
Demographics: 41/51/6/1
Prez ‘08: 70-30 Obama
Average: 63-37 Democratic
This is another of my favorite districts. I had originally planned for the 40-percent Democratic areas of James City to be put in a Republican district, but as I started to draw this district, I realized that wouldn’t be necessary. This way, those areas (which are home to Norment, the Senate Republican leader) are sunk into an African-American-majority district based in Richmond and Henrico County. Marsh would easily win here. SAFE D.
District 22 (sienna): Walter Stosch (R-Henrico County)
Demographics: 69/17/5/7
Prez ’08: 57-42 Obama
Average: 52-48 Democratic
This is a modified, and much more Democratic, version of Stosch’s current district. He loses the most conservative areas of Henrico, and all of his part of Hanover, and gains some strongly liberal areas of Richmond. Stosch is 77, so it’s quite likely that he would retire if faced with a district like this. Democrats would be favored here. LEAN D with Stosch, LIKELY D without him.
District 23 (aquamarine): A. Donald McEachin (D-Henrico County)
Demographics: 56/35/4/3
Prez ’08: 61-38 Obama
Average: 57-43 Democratic
This district takes in the leftover Democratic and African-American areas of Richmond and Henrico. It then punches through far-right Hanover County (but including the light-blue town of Ashland), takes in all of Caroline, and then includes a small portion of Spotsylvania and all of Fredericksburg. It doesn’t even look that bad, and McEachin would be completely safe here. SAFE D.
District 24 (indigo): Ryan McDougle (R-Hanover)
Demographics: 86/9/2/1
Prez ’08: 66-33 McCain
Average: 66-34 Republican
This strongly Republican district stretches from Poquoson to Mechanicsville, and includes the southern part of Virginia’s Chesapeake Bay shoreline. McDougle actually lives just over the line in the 23rd, but he would definitely run here. Tommy Norment also represents a significant chunk of this district, so he might try to run here as well. Whichever Republican wins the primary will definitely win the general here. SAFE R.
District 25 (pale violet red): Richard Stuart (R-Westmoreland County)
Demographics: 60/27/8/3
Prez ’08: 54-45 Obama
Average: 51-49 Republican
This district takes in the less-Republican northern part of Virginia’s Chesapeake Bay shoreline, as well as the Aquia Harbor area of Stafford County and the heavily-Democratic Dumfries area of Prince William. The northern part of this district is where most of the growth is, and while Stuart might not be easy to dislodge, Democrats did just elect a state Delegate (Michael Futrell) from the northern part of this district. He might be someone who could unseat Stuart. TOSSUP.
District 26 (gray): Thomas Garrett (R-Louisa County), Bryce Reeves (R-Spotsylvania County)
Demographics: 79/13/4/3
Prez ’08: 59-40 McCain
Average: 63-37 Republican
This district, which looks kind of similar to Eric Cantor’s congressional district, stretches from the western suburbs of Richmond up to the Fredericksburg area and almost to Culpeper. It is already heavily Republican, and might get even more so as the Richmond suburbs spill increasingly over into Hanover, Goochland, and Powhatan Counties. This is another district that would probably have a hard-fought Republican primary but a pretty quiet general election. SAFE R.
District 27 (spring green): Emmett Hanger (R-Augusta County)
Demographics: 91/5/3/1
Prez ’08: 64-35 McCain
Average: 68-32 Republican
This district, one of the reddest in the state, is located in the heart of the Shenandoah Valley and takes in Augusta, Staunton, Waynesboro, most of Rockingham, and a small part of Shenandoah. This is one place where Obenshain could run assuming he loses the recount, however Hanger would probably defeat him in the primary. Either way, a Republican will represent this district. SAFE R.
District 28 (plum): Open
Demographics: 88/5/5/1
Prez ’08: 57-42 McCain
Average: 61-39 Republican
This district is located in the northern end of the Shenandoah Valley. No incumbents live here, but Obenshain represents some of this area already, so he could run here. Jill Vogel could run here (she represents Frederick and Winchester), though she’d probably run in the 30th, since she lives there. A Republican will win here regardless, though. SAFE R.
District 29 (dark sea green): Open
Demographics: 82/10/5/2
Prez ’08: 56-43 McCain
Average: 60-40 Republican
This is another open seat located in the north-central part of the state. Hanger, Obenshain, Vogel, and Stuart all represent parts of this district, but none of them live here. However, there’s no way a Democrat could win here. Any Republican would be safe. SAFE R.
District 30 (light coral): Jill Holtzman Vogel (R-Upperville), Richard Black (R-Loudoun County)
Demographics: 81/6/6/7
Prez ’08: 55-45 McCain
Average: 58-42 Republican
This district takes in the most Republican suburbs and exurbs of Northern Virginia. Vogel definitely lives here (in Fauquier County), while Black could live anywhere in Loudoun County, but if he were to run anywhere it would probably be here. There could be an opening for a Fairfax/PW candidate here in the Republican primary. However, ultimately it doesn’t matter, because a Republican will definitely win here. SAFE R.
District 31 (khaki): Chuck Colgan (D-Prince William County)
Demographics: 50 (49.8)/12/22/14
Prez ’08: 58-41 Obama
Average: 51-49 Republican
This majority-minority district is based in central PW County and includes Manassas, Manassas Park, and part of Centreville. Colgan is in his 80s and will probably retire soon, but Democrats would be favored to keep the seat. Despite the fact that much of the growth here has come from Hispanics who don’t show up in odd-numbered years, the PW County Dems seem to be organized (Obama did just as well there in 2012 as he did in 2008), and, as mentioned previously, Dems picked up a Delegate seat in PW County this year. LIKELY D.
District 32 (orange-red): Toddy Puller (D-Mount Vernon)
Demographics: 47/22/21/7
Prez ’08: 62-38 Obama
Average: 54-46 Democratic
This is another majority-minority district, and it is based in Dale City, Woodbridge, and Mount Vernon. It is one of the most diverse districts in my map, and thus it is no surprise that it is quite Democratic. It is safely Democratic, and only getting more so. SAFE D.
District 33 (royal blue): George Barker (D-Fairfax County), Dave Marsden (D-Burke)
Demographics: 57/9/14/18
Prez ’08: 59-40 Obama
Average: 54-46 Democratic
This district is based in south-central Fairfax, and includes Burke, Springfield, West Springfield, and Newington. This district is much improved for Democrats, and we shouldn’t have any problems here. SAFE D.
District 34 (lime green): Mark Herring (D-Loudoun County), probably soon to be Open
Demographics: 69/6/11/13
Prez ’08: 59-41 Obama
Average: 54-46 Democratic
This district changes dramatically. It takes in Leesburg and Sterling, and then includes Great Falls, part of McLean, Falls Church, and a small portion of Arlington. Both Favola and Herring represent parts of this district, but Favola has another district under this map (the 39th) while Herring does not. Of course, in all likelihood, he won’t need one. SAFE D.
District 35 (dark orchid): Janet Howell (D-Fairfax County)
Demographics: 58/8/15/17
Prez ‘08: 60-40 Obama
Average: 53-47 Democratic
Howell’s district moves northwest and takes in a large chunk of Loudoun County along with her strongly-Democratic chunk of Fairfax (which includes Herndon and part of Reston). Howell won 60 percent in 2011, so she should be safe even in this slightly-less-Democratic district. SAFE D.
District 36 (orange): Open
Demographics: 57/7/10/23
Prez ’08: 59-40 Obama
Average: 53-47 Democratic
This district is located in southeastern Loudoun and southwestern Fairfax, and includes Chantilly and parts of Centreville and Reston. Either Barker or Marsden should move here and run in this district. It’s more Democratic than either of their current districts. LIKELY D because there’s no incumbent.
District 37 (dodger blue): Open
Demographics: 55/17/17/10
Prez ’08: 65-34 Obama
Average: 61-39 Democratic
This district contains part of Alexandria and the areas south of it, including Fort Hunt, Franconia, and Groveton. No incumbent lives here, but Adam Ebbin should move here and run here, because he represents some of this area already, and he really doesn’t have any better options. SAFE D.
District 38 (medium aquamarine): Chap Petersen (D-Fairfax City)
Demographics: 58/5/15/20
Prez ’08: 60-39 Obama
Average: 56-44 Democratic
This district is located in the heart of Fairfax County, and includes Fairfax City, Oakton, Vienna, and Mantua. Petersen defeated a Republican incumbent in 2007 and won easily in 2011, so he should be pretty safe. SAFE D.
District 39 (moccasin): Barbara Favola (D-Arlington)
Demographics: 67/8/12/10
Prez ’08: 71-29 Obama
Average: 67-33 Democratic
This district consists of most of Arlington, and then the parts of McLean closest to the Potomac. Favola will be completely safe here. SAFE D.
District 40 (firebrick): Richard “Dick” Saslaw (D-Fairfax County)
Demographics: 47/17/23/11
Prez ’08: 72-28 Obama
Average: 68-32 Democratic
This district contains part of Alexandria and some inner suburbs such as Jefferson, Annandale, and Lincolnia. Saslaw, the Democratic leader in the Senate, is very safe here. SAFE D.
The final total is:
18 SAFE D (4,6,8,9,12,14,15,16,21,23,32,33,34,35,37,38,39,40)
5 LIKELY D (7,11,13,31,36)
3 LEAN D (1,19,22)
2 TOSSUP (5,25)
12 SAFE R (2,3,10,17,18,20,24,26,27,28,29,30)
As you can see, under this map the Democrats would easily be able to win a substantial majority of the seats in the Virginia State Senate.
I hope you enjoyed reading, and I welcome any feedback or questions!

