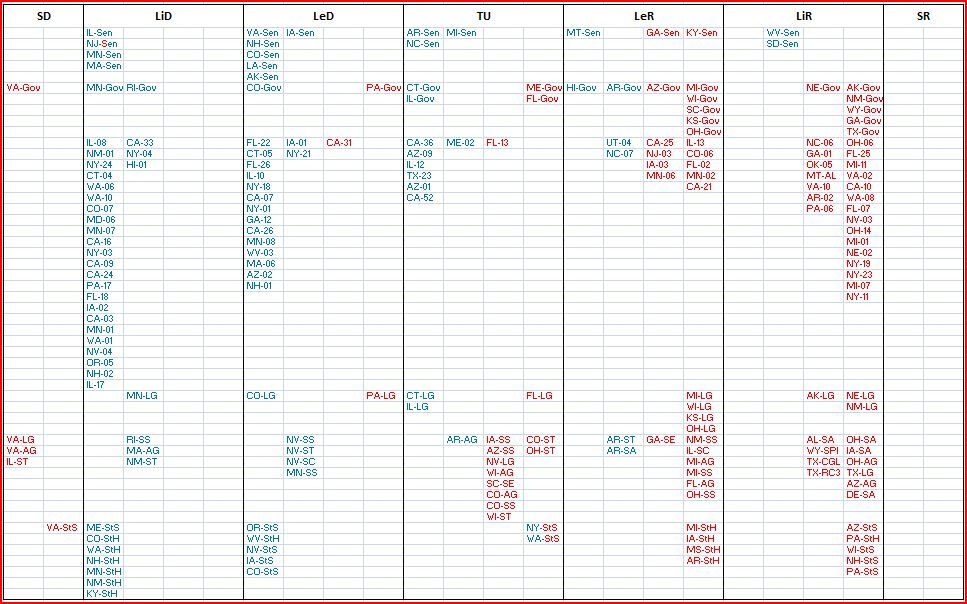
This is my rating chart updated to february 25, 2014:
Click in the image, to see it in larger size. First it will open the image in photobucket and then you can zoom to see the image in the natural size.
First a few notes about the chart.
NOTES
The chart has a resume of all the 2013-14 cycle, including some races that has been done and appear as safe at this point, to make easier a net count of gains and loses for the entire cycle.
This model of rating chart includes habitually:
- The rating of the presidential election by state (obviously not for 2014).
- The rating for the US Senate races.
- The rating for the Gubernatorial races.
- The rating for the US House races.
- The rating for the Lieutenant Governors that run in the same ticket than the Governor.
- The rating of the statewide elected offices including the separtely elected Lieutenant Governors.
- The rating for who will win the majority of the state chambers.
Note: Many people is focused only in a few levels but I think every level has the own importance.
Also in every rate there are 4 columns:
- The first for offices with Democratic incumbent.
- The second for the offices open by a Democrat.
- The third for the offices open by a Republican.
- The fouth for the offices with Republican incumbent.
Note: The SafeD and SafeR groups only have the columns for the offices of the opposite party.
In the group of the statewide elected offices the races are named by the reference to the state and the first letters of every word:
- LG: Lieutenant Governor (in the case of the LG elected separetely).
- SS: Secretary of State.
- AG: Attorney General.
- ST: State Treasurer.
- SA: State Auditor.
- SC: State Comptroller.
- SE: Superintendent of Education (SC and GA)
- SPI: Superintendent of Public Instruction (WY)
- CGL: Commissioner of General Land Office (TX)
- RC3: Railroad Commissioner 3 (TX)
There is a color code that talk about the party that hold the office in the cycle. As example you can see the case of NJ-Sen. First blue (F Lautenberg D), later red (J Chiesa R) and finally blue (C Booker D). Also it talk about the change in the senate majorities of WA and NY thanks to the defection of some Democrats, and can talk also about the possible change in FL-13.
This rating chart is calculated only following numerical rules that I designed for it. The rumerical rules are symetric and are the same for every case.
As a chart with numerical origin, it is done with the data until february 25. It can be considered like a picture of the current situation and also is used in a predictive way as the election data gets closer. Updating the chart until the election day, the chart becomes a strong tool for me to predict the final results of every race.
CONCLUSIONS
As expected, this cycle is giving better chance for the Democratic Party in the gubernatorial and in the statewide elected offices fronts, while is making more difficult the US senate front. The reason for it is that the senate races come from the 2007-08 cycle, that was good for the Democratic party, while most of the gubernatorial and statewide offices come from the 2009-10 cycle that was a bad cycle for the blue team.
Most of the races where the Democratic party has a chance are becoming open, and are in blue states.
Most of the blue states have some office/race in the range between LeD and LeR. And here is where will be most of the action this cycle. Only MD and RI have all the races in better than LeD situation. In the other side DE and VT also have not competitive races at this point, but have D+ offices in Republican hands that can become competitive by the end of the cycle (DE-SA and VT-LG). The fight to win the maximum number of races is assured in every blue state except maybe in VT. In the blue states, the Republicans are focusing their defense of the 2010 offices basically in the protection of their governors.
For the EVEN and R+ states, only a few races are becoming really competitive. Still, the Democratic party is fighting strongly in VA, GA, WV, SC, OH, FL, AZ, AR and KS, plus in some isolate race like LA-Sen, AK-Sen, NC-Sen and TX-23.
In the fundraising side, the Democratic party has a fundraising lead in every race that has better than a Toss-Up rating, except in NV-ST, where K Wallin has a deficit. For the next fundraising report also NY-21 can go to this group (also can have a worse rating). The Democratic party also has a fundraising lead in most of the Toss-Up races. The reason for it is that the Republicans are not fighting seriously the races where they see not a chance. They are taking a defensive strategy except in the case of the US senate (and IL-Gov thanks to a millionaire).
The polling in this cycle is being a little weird. Many high level races remain unpolled. Also we see many polls only for the primary, that give not a real information about the balance between both parties. And finally some weird cases like HI-Gov, that need new polls for confirmation. Still, following the pre-poll numerical rules that give me good results, the rating chart can be finished and published.
For the short term the special election in FL-13 is very important, and should be a victory for the blue team because all the fundamentals of the race are favoring the Democratic candidate except the R+1 PVI and the outside money.
Looking at the end of the cycle, we can see some changes that agree with the final years of the long term realignment (still not finished), but we will see not many changes. Thanks to the statewide offices the Democratic Party can have overall gains this cycle. The most important question is if the majority in the senate will change or not of hands.
This cycle, I see one danger for the left, for the Democratic Party. There is a risk of opening too much the map and of fighting too much for too difficult races in too difficult constituencies. Also, I understand not, to fight not ME-Sen this cycle.
Well, this is all. Here is an overall picture of the current situation with some predicting implications.
