This is an unofficial update to the free online redistricting tool, Dave's Redistricting App. Those of you who enjoy using the program are familiar with how it only has 2008 presidential election results (for all but three states) and those are becoming dated now at nearly 6 years old, but unfortunately many states redraw their precincts between elections making them incompatible with DRA. Additionally, in many regions downballot elections are more informative of partisan strength when drawing districts and only a few states have those in the app. Thus I've created Microsoft Excel spreadsheets where you can relatively easy calculate other election results by district, though with varying degrees of estimation error since the numbers are based on the actual county-level results plus the 2008 presidential precinct results.
The way I produced these estimates was to take the actual DRA 2008 precinct results, mostly calculated by DKos user roguemapper aka Steve Gerontakis, and divide Obama and McCain's vote totals by their respective county total and multiply that proportion by county totals for other races. Thus if Precinct 12 cast 5% of McCain's votes in Washington County, it is estimated to have cast 5% of Romney's votes from the same county. As such, this method and using the spreadsheets I've made works fantastic for district maps with minimal county splits, or if only small or homogeneous counties are split. For larger counties, particularly those that are racially diverse and contain many districts (such as Miami-Dade), the degree of estimation error might be larger.
The New England states minus Maine used municipality-level data rather than counties, meaning they're basically dead on outside of Boston or Providence, while several states have actual precinct data included: Arizona (2010), Kentucky (2011-2012), Maryland (2010), Minnesota (2010), New Hampshire (2006-2012), and North Carolina (2008-2012). Kentucky is missing a few minor, largely inconsequential counties for which I've substituted estimates, but out of all the states down-ballot precinct numbers probably help here the most. Note that for most elections I excluded minor party candidates' vote totals.
You can find each spreadsheet available for download here by state, with the voting district results that you'll want to use being on the page furthest to right. For each state I've either calculated or estimated the results for 2012 and 2004 president along with most or all partisan statewide races from 2006 to present. To use this data, all you need to do once you've drawn districts is select the option "Save VTD Data as CSV" which will produce an Excel sheet with all of that state's precincts or voting districts. Then just copy the district column over to my spreadsheet and use the Excel functions Sort and Subtotal under the Data page and voila (you may need to save the subtotals in another program like notepad before copying them to another part of Excel).
Once you have these numbers you can simply paste them over the election results by the actual congressional districts contained in the CD Detail sheet. Each spreadsheet also contains my display table template for a summary of the census data and presidential results generated by the "Save CD Data as CSV" function; you can find those display tables separately for 2008 and 2012 here. Each spreadsheet also contains extensive 2000-present county level results for partisan elections along with some results by legislative district.
Below I'll show some example screenshots (click through for full sized image) and walk you through the above steps. If you happen to have a complete precinct data set that matches up with the app (or township level data for certain states), please send it to me and I can add it to improve the estimate's accuracy.
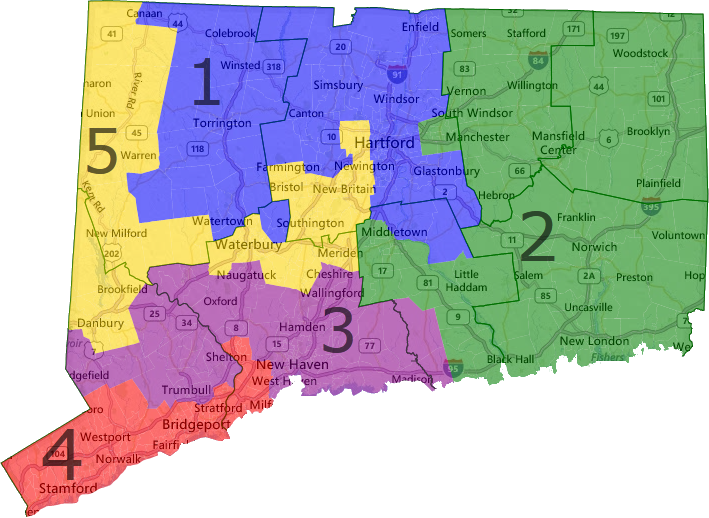
Here I've drawn a hypothetical Democratic gerrymander of Connecticut, with the intent to shore up Elizabeth Esty who only narrowly won in 2012 and in doing so make all five districts give Obama over 58% of the two party vote. Many parts of Connecticut swung unevenly in 2012 with heavily minority and Democratic towns like Hartford not moving much at all while wealthy suburbs like Greenwich moved sharply to Republicans. To make things easier, I split zero towns so the results will be exact.
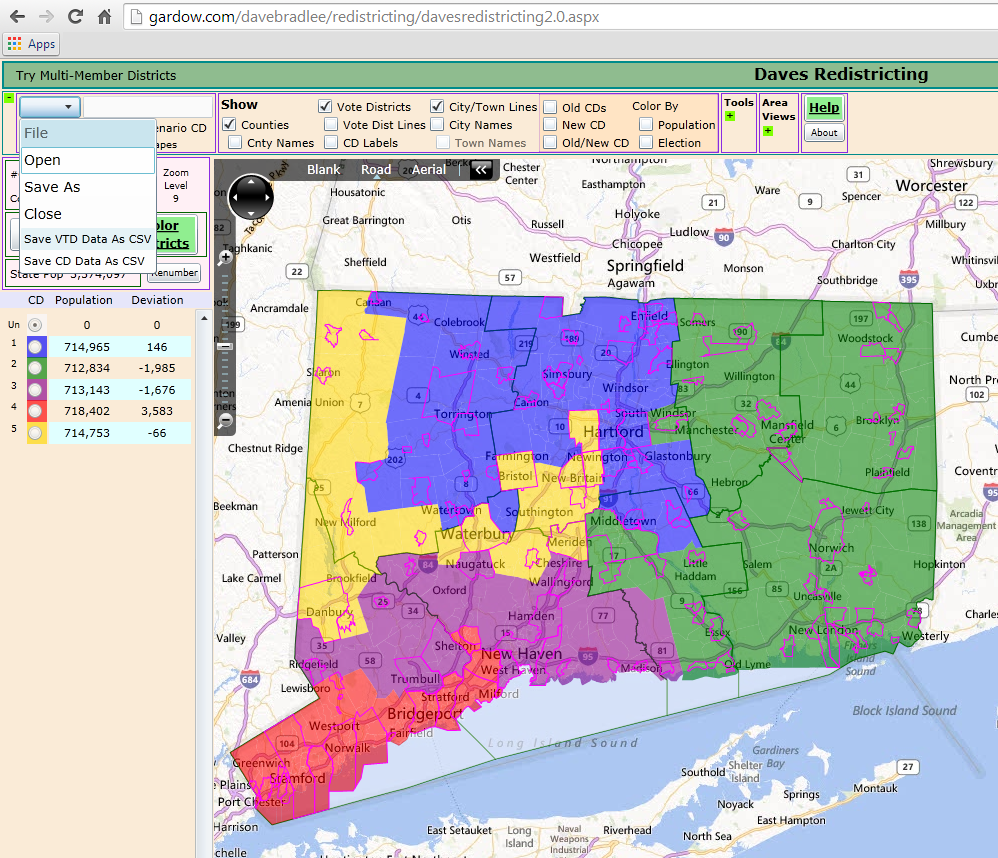
Once you've drawn a map, you will want to compile the demographic data and calculate the relevant election results. This video example demonstrates how, but I will explain it here as well. First, go to save the VTD data as a .csv so you can get a spreadsheet which lists the map district for every precinct/voting district.
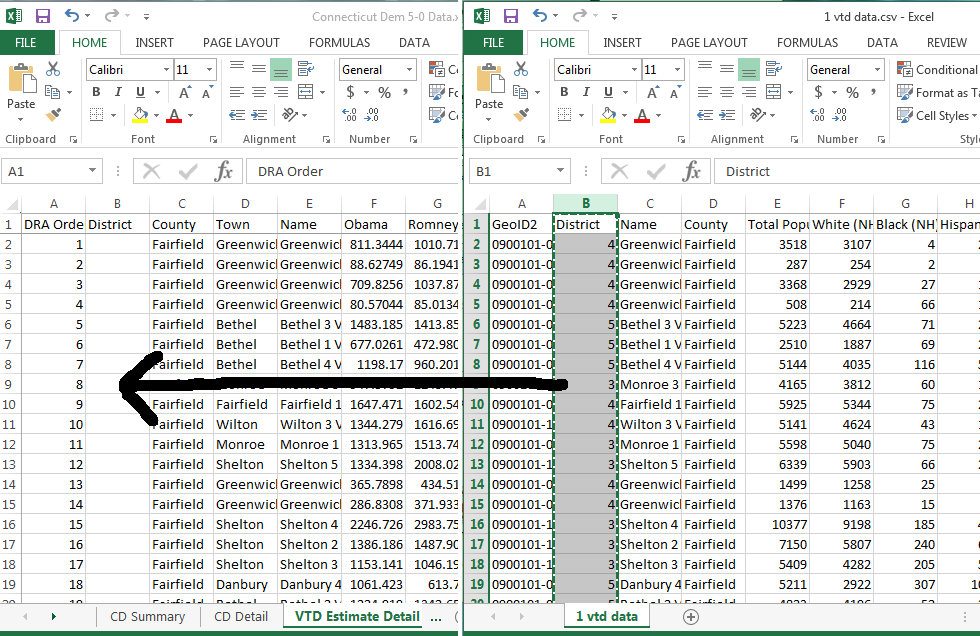
Open that file and copy the district column into the empty district column in the VTD Detail sheet for the appropriate state (note I'm using the Windows MS Office 2013 version of Excel).
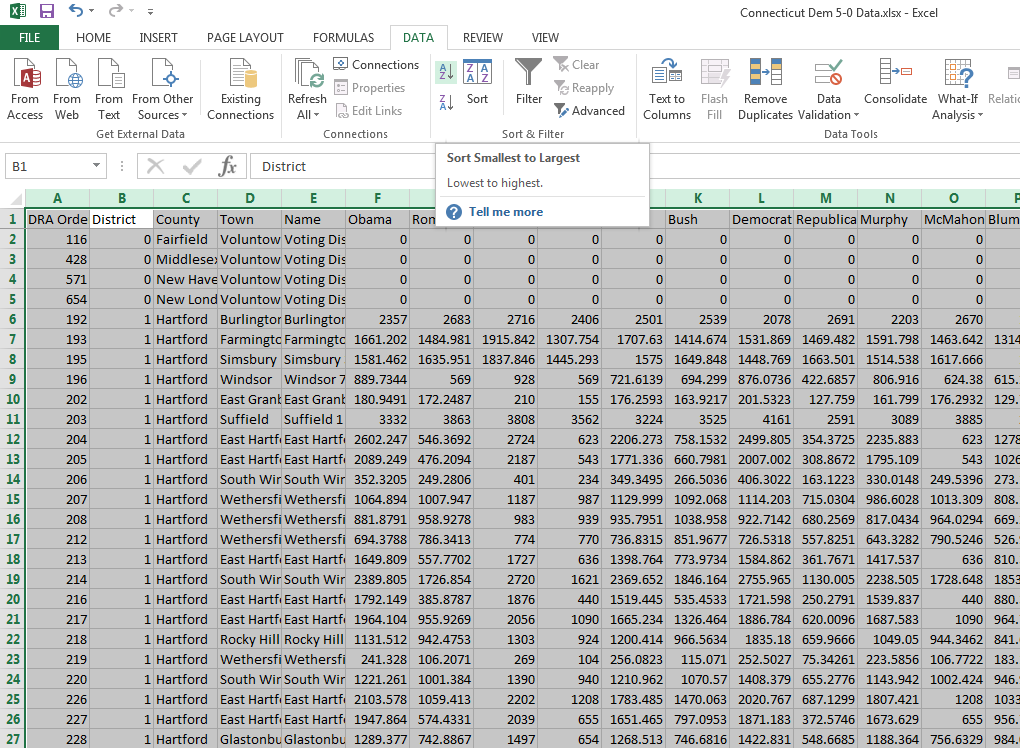
Then select all the data and use Excel's sort function to sort by the district column.
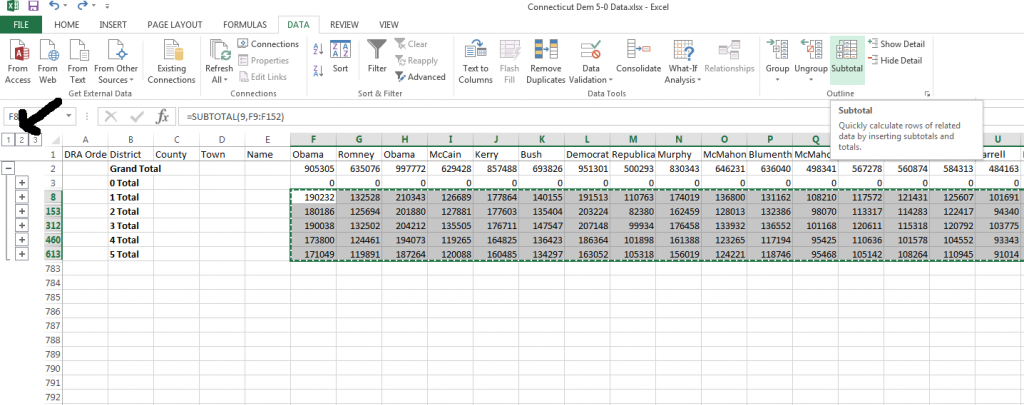
Now you can subtotal the vote totals by the district column. Click the 2 on the far left to collapse the columns so that just the subtotals are visible and now you can copy those into another program like notepad so you can then copy just the subtotals and not the underlying numbers back into Excel (you'll probably want to undo the subtotaling before copying the numbers back in). Make sure to re-sort by the first column "DRA Order" before copying in any new district numbers from a “VTD as .csv”.
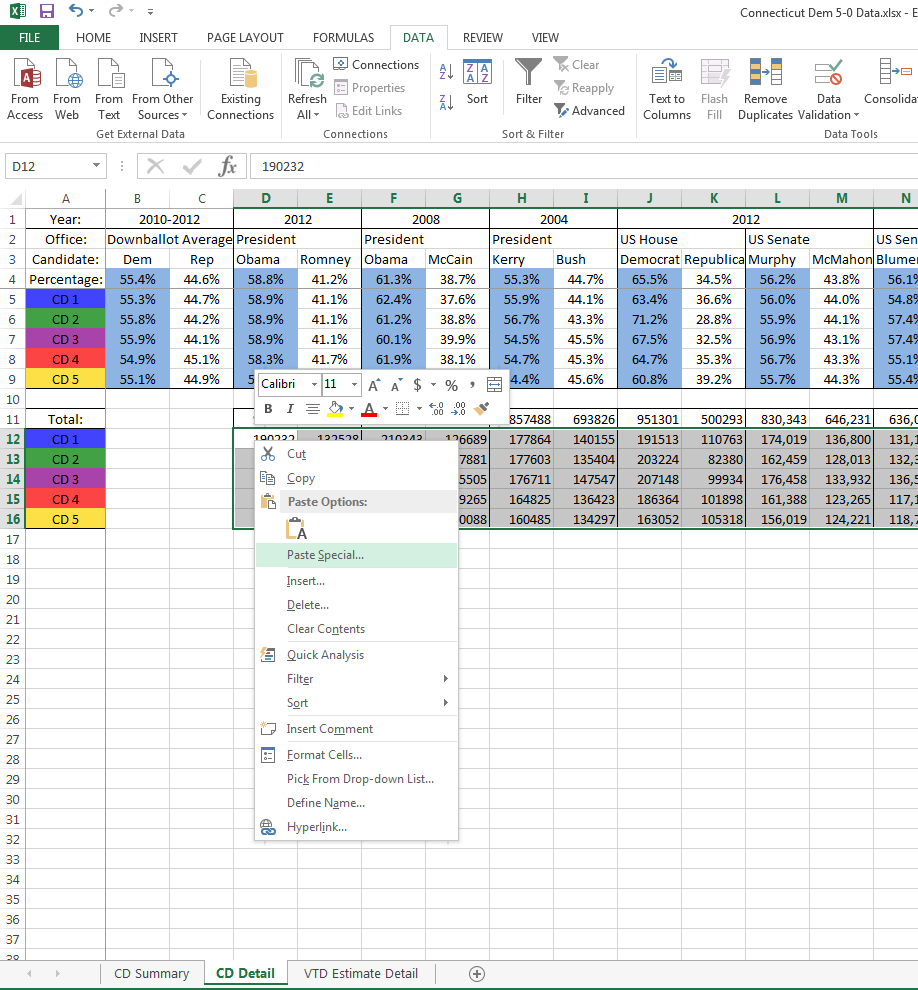
Switching over to the CD Detail sheet, you can now paste those district subtotals in where the results for the actual districts are and the sheet will automatically calculate the two-party vote share and color code the districts by the winner for each race, here with that being the Democrats by solid margins in every district as was my goal.
Since you probably don't need to show every election available, the sheet also calculates a partisan average which you might copy to the CD Summary sheet along with the presidential results. I've found this to often times be a good measure of partisanship in certain states since it evens out individual candidates' regions of strength or weakness.
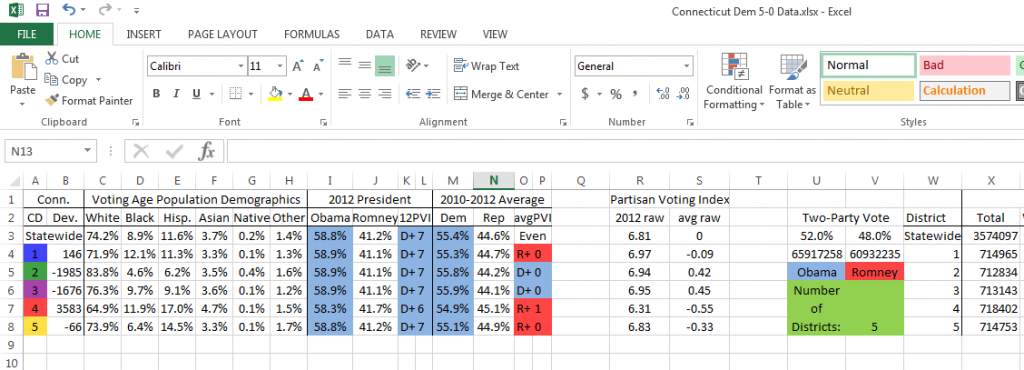
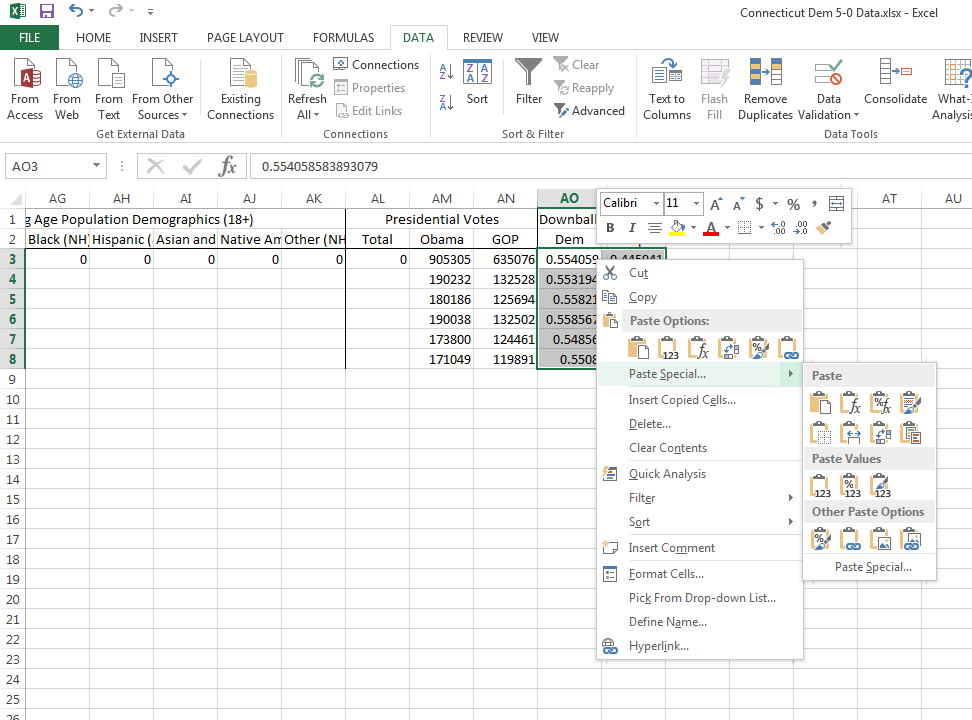
Now the last thing missing is the census demographic data from DRA. Go back and select Save CD Data as CSV like you did for the VTD Data. Open that sheet, select all the cells for the racial breakdowns but not the presidential results (unless you want to use those instead). Copy those into the CD Summary sheet in the table in the right of the sheet. Once you select the number of districts in the green cell you'll have finished the display table. The table itself shows from left to right the deviation from ideal population, the voting age population racial breakdowns (if a group is a majority-minority the cell is shaded), the two-party presidential vote percentages with the single-year PVI and the average with PVI-even being the state itself.
Now you can select the cells from the template and copy them into an image editing program like MS Paint to save and upload for sharing your map like this:
 Note this chart sets the pop. deviation to percentages, but the default is the raw number of persons from ideal
To be able to post such images on Daily Kos, all you have to do is upload them to the Image Library. Enjoy!

