A crucial term to familiarize yourselves regarding any discussion about the Cryosphere is albedo.
Albedo is defined as the fraction of solar energy (shortwave radiation) reflected from the Earth back into space. It is a measure of the reflectivity of the earth's surface. Ice, especially with snow on top of it, has a high albedo: most sunlight hitting the surface bounces back towards space. Water is much more absorbent and less reflective. So, if there is a lot of water, more solar radiation is absorbed by the ocean than when ice dominates.
The Arctic sea-ice minimum can be accurately forecasted from melt-pond area in spring. Scientists have found a strong correlation between the spring pond fraction and September sea-ice extent. This is explained by a positive feedback mechanism: more ponds reduce the albedo; a lower albedo causes more melting; more melting increases pond fraction. The results of a study highlighted in Nature, explain the acceleration of Arctic sea-ice decrease during the past decade.
Scientific American, highlights the work of the "Indiana Jones” of mathematics, Ken Golden. In 2012, Golden and others published a paper "showing that as sea ice melts the ponds that form on its surface can in some ways be treated like fractals, mathematical patterns that remain the same or similar at small and large scales."
As isolated simple ponds grow and connect with others, they form larger, more complex ponds; subsets of these ponds show similarities to the larger complex ponds, just as a fractal does. In addition, as ponds get larger and more complex, the total perimeter of the ponds increases much faster than the total area of the ponds, which is also the case with fractals. “Any kind of information you can get about how [melt ponds] evolve, their geometry, their area coverage … are the key parameters that go into assessments of albedo,” Golden says.
Golden has also looked at the microstructure of the sea ice. Specifically, he has modeled “brine inclusions,” or pockets of liquid water within the ice. The formation of these pockets depends on the temperature and crystallographic structure of the ice, which in turn depends on how the sea ice formed. He found that there is a threshold at which these inclusions become connected to one another and form pathways, allowing drainage of melt ponds or percolation of sea water upward from beneath the ice.
I read that the ice sheets can now be described as swiss cheese floating on the sea. This is a serious challenge to the entire structure of the ice column.
Robert Simmon explains for NASA's Earth Observatory:
"As the ice sheet melts, water collects in large pools on the ice surface. Streams drain the pools, sometimes carrying water into other pools, but sometimes disappearing into crevasses or cracks in the ice. The crevasses take the water deep into the ice sheet, sometimes even to the underlying rock, where it lubricates the lowest layers of the ice. The lubricated ice flows more quickly toward the ocean, which in turn accelerates the rate at which icebergs break into the sea. The overall result is a greater loss in ice mass than would happen without the influence of melt water streams."
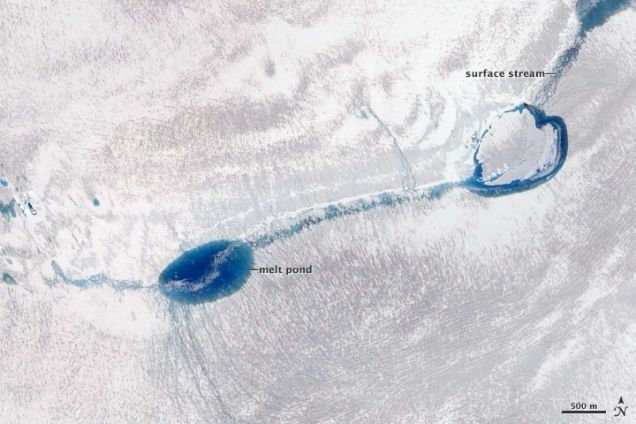
A stream linking melt ponds in Greenland in June 2010. Image credit & read more: NASA/Earth Observatory
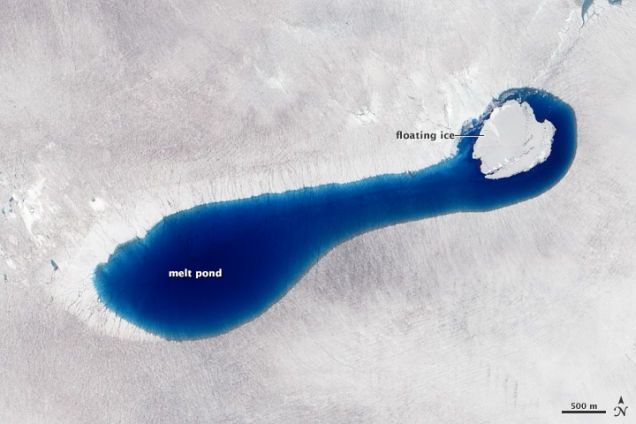
Melting ice has deepened the feature into one long melt pond with an icy island by July 2010. Image credit & read more: NASA/Earth Observatory
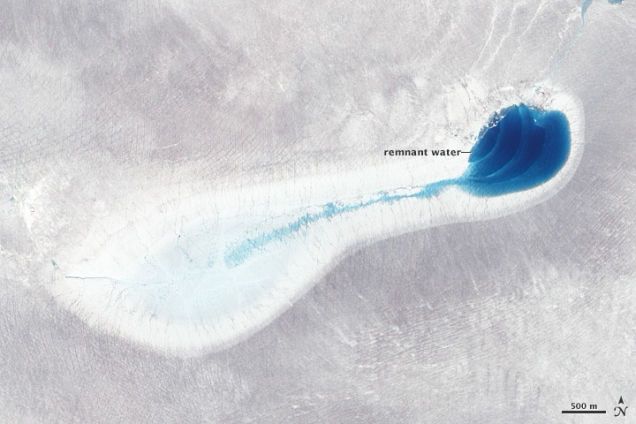
The pond is almost empty, possibly due to draining down a deep crack (moulin) in the basin. Rings mark the high-water line. Image credit & read more: NASA/Earth Observatory
There are thousands of unsung heroes and heroines that are collecting and analyzing glaciological and other climate data that can be used in mitigating and providing the necessary information for planners to proceed in the battle against climate catastrophe. As I, a non-scientist, do my best to educate myself about green issues, it all seems so incredibly complicated and overwhelming. I am not immune to the discouragement that all people feel who are following this most critical of issues. What we are up against in making progress? The climate deniers are buffoons and can be dismissed, the climate enablers are creating inter-generational crimes, and most of our leaders and politicians play their Stradivarius as the world burns. But the Scientists? They continue with their work providing us with uninterrupted data sets that, when and if, we finally get our act together we can perhaps change the catastrophic trajectory that we are currently on. I am highlighting some of those heroes in this diary. We owe them our energy and effort as non-scientists to inform and educate the minds of, and appeal to the hearts of the 99% (many of which have been lied to and propagandized by the 1%). If we do not do this the Koch brothers and their ilk will kill every last one of us even though they seem to believe that they can somehow survive-they won't. I do believe that the Daily Kos has the ability to think outside the system. Perhaps that is where our efforts now need to go?
On August 30,2010 after seven years gathering data on ice sheets and sea ice dynamics, a NASA satellite met its fiery end in the Earth’s atmosphere before plunging into the sea. Icesat had provided a multi-layer elevation data needed to determine ice sheet mass balance, provide cloud property information, especially for stratospheric clouds common over polar areas and other polar specific information over Greenland and Antarctica's ice sheets. The satellite was a total success and even lasted a couple of years longer then expected. Together, these datasets will allow for continent-wide estimates in the change in volume of the Greenland and Antarctic ice sheets over a 15-year period, and long-term trend analysis of sea-ice thickness.
ICEsat2, the next generation satellite Is not due to be launched until 2017. Together, these datasets will allow for continent-wide estimates in the change in volume of the Greenland and Antarctic ice sheets over a 15-year period, and long-term trend analysis of sea-ice thickness.
The 7 year gap between the 2 would cause scientists to miss a lot of crucial data sets. The project to continue polar ice surveys between ICESat and ICESat2 is IceBridge.
IceBridge, a six-year NASA mission, is the largest airborne survey of Earth's polar ice ever flown. It will yield an unprecedented three-dimensional view of Arctic and Antarctic ice sheets, ice shelves and sea ice. These flights will provide a yearly, multi-instrument look at the behavior of the rapidly changing features of the Greenland and Antarctic ice. Data collected during IceBridge will help scientists bridge the gap in polar observations between NASA's Ice, Cloud and Land Elevation Satellite (ICESat) -- in orbit since 2003 -- and ICESat-2, planned for late 2017. ICESat stopped collecting science data in 2009, making IceBridge critical for ensuring a continuous series of observations. IceBridge will use airborne instruments to map Arctic and Antarctic areas once a year. The first IceBridge flights were conducted in March/May 2009 over Greenland and in October/November 2009 over Antarctica. Other smaller airborne surveys around the world are also part of the IceBridge campaign.
Must see spectacular footage filmed by IceBridge and edited like only NASA Goddard can.
From the You tube video with added video links regarding IceBridge.
The views from the cockpit of NASA's P-3B aircraft on an Operation IceBridge campaign are truly stunning. The mission doesn't travel to both ends of the Earth for the scenery of course -- the airborne mission is there to collect radar, laser altimetry, and other data on the changing ice sheets, glaciers, and sea ice of the Arctic and Antarctic. But for those of us who aren't polar pilots, here's a selection of some of the best footage from the forward and nadir cameras mounted to the aircraft taken during IceBridge's spring deployment over Greenland and the Arctic Ocean.
This video is public domain and can be downloaded at: http://svs.gsfc.nasa.gov/...

