Let's recap our SO2-level readings.
600 µg/m³: Highest of the first post-eruption recordings in Iceland; they blew away Iceland's previous SO2 record by 2 1/2 times over. Also the levels which, when I was working on my land painting only caused minor symptoms, but when I switched to heavy fence work with a sledgehammer, developed breathing problems whose symptoms took a few days to go away.
2600 µg/m³: Subsequent record breaker in Reyðarfjörður, described as being like breathing from the tailpipe of work equipment.
4000 µg/m³: Reyðarfjörður's subsequent besting of their previous record.
5800 µg/m³: Mývatn's taking over as the worst-pollution record-holder
So how much did Höfn break the record by? A couple hundred µg/m³? A thousand maybe?
Not exactly. Join us below the fold...
7000 µg/m³.... would have been nice if that was all the higher it went, but that's not where the meters stopped. No, 8000 µg/m³.... is also too low. The actual numbers? 9000 µg/m³.... but that's only for downtown earlier in the evening. Then it hit 18500 in town. On the outskirts of town, levels hit 21000 µg/m3
My thoughts on the subject?

"Residents are Experiencing Discomfort" says the headline. Gee, d'yathink? The civil protective services have been sending warning messages all day - 5 times now - to tell people to stay indoors and not venture outside. People seem to be following these instructions.
Extreme levels of pollution remain over the city as of this evening - at the time of writing this section, they're at 7600 µg/m³ and have been over the briefly-reached record from Mývatn for many hours. Pollution levels are expected to improve but not go away tomorrow. Both adults and children are expected to continue to be kept inside; even short walks to school are strongly advised against.
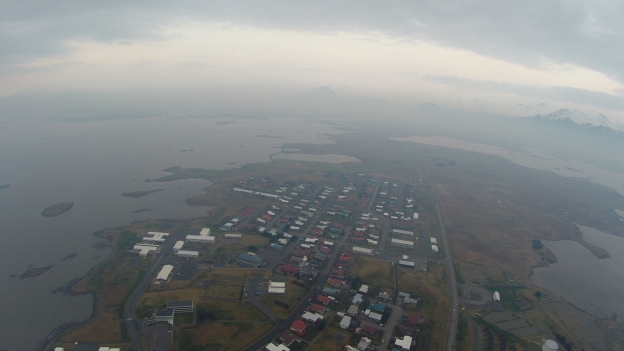
(Credit: Úlfar Finnsson)
The head of the civil protective services complained, "The file [on health effects of SO2] that we got from Hawaii doesn't go up to 15000 [µg/m³]"
In addition to the normal response recommendations, the civil protective services has added some new ones: to run cold water from their faucets at full power, and for those who are having difficulty, to have available a washcloth soaked in a mixture of water and baking soda.
Even before these levels were measured, pollution was in the news - not in the short term perspective, but in the long-term. Þorvaldur Þórðarson, a professor in volcanology, says that the consequences of long-term exposure to exposure to a sulfuric acid mist from the SO2 of the eruption are concerning. He points out that increasingly pollution is reaching parts of Iceland not directly, but by leaving the country, being blown around over the ocean, and then coming back to the island with more of the SO2 converted to H2SO4.
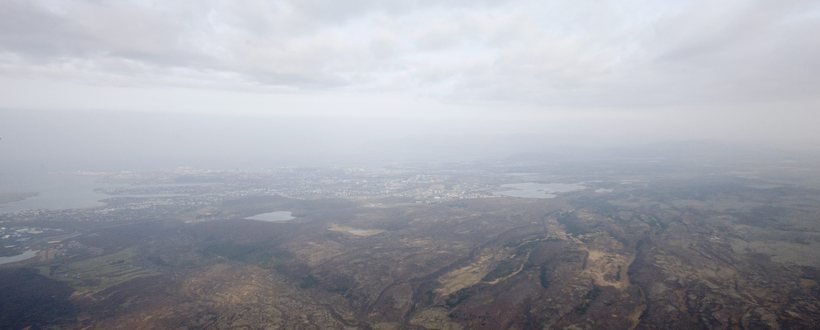
(Reykjavík; Credit: MBL/Þórður Arnar Þórðarson)
All of this is a side topic from what I planned to write about this evening... but clearly it stole the show :Þ
Tonight, I'd like to take a moment to go on a seismic "tour" of the subsidence in Bárðarbunga's caldera. First off, let's look at the standard of what we're told: quakes form a nice ring around the edges of a subsiding plug down to the magma chamber:
(Credit: Veðurstofan)
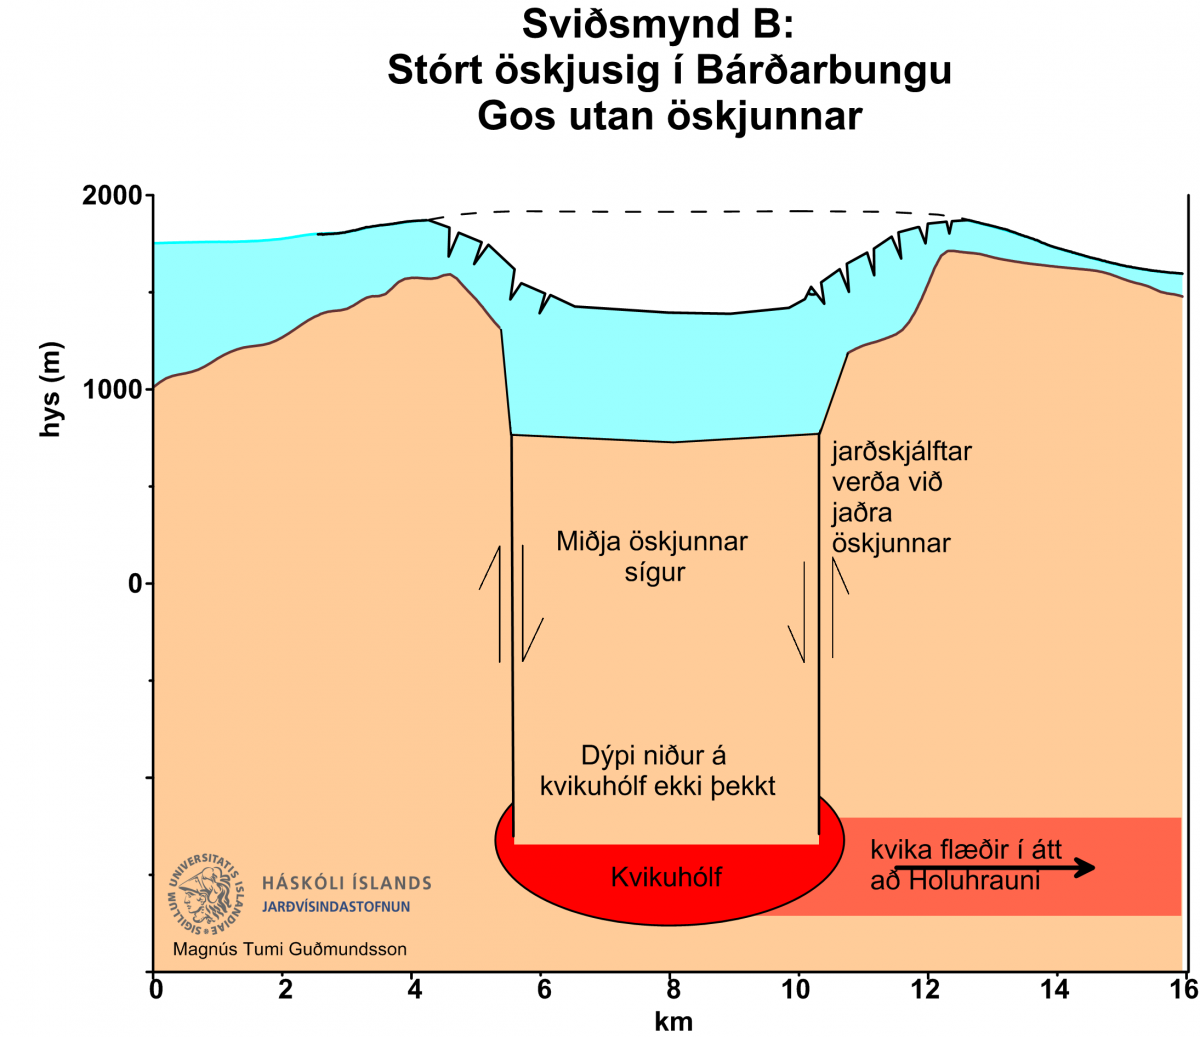
(Credit: Jarðvísindastofnun)
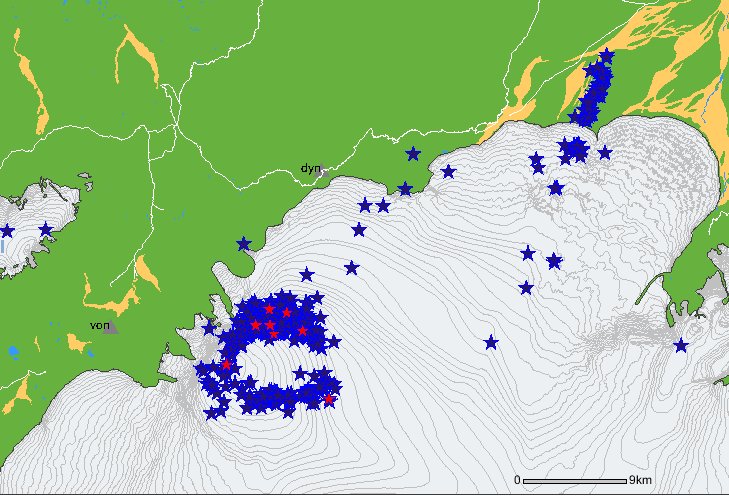
Great. But these are just simplifications. First, let's look at that whole "ring" thing in more detail, filtering down the time period so you can see roughly how often quakes are occurring in each area:
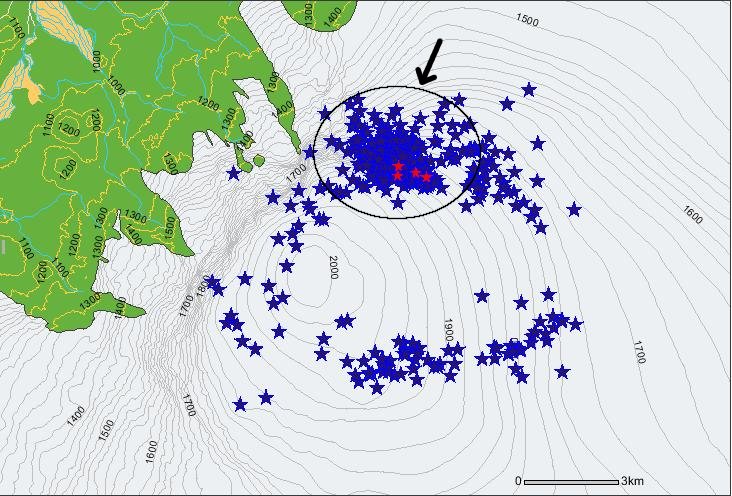
(Credit: Veðurstofan)
As you can see, they're not even remotely close to evenly distributed. They're overwhelmingly in the north/northwest cluster, with several other smaller clusters. Other places are nearly absent in terms of quakes.
When we look at vertical distributions of quakes, we see that this nice simple conception of a straight sinking plug also fails. First, here's how the quakes align north-south:
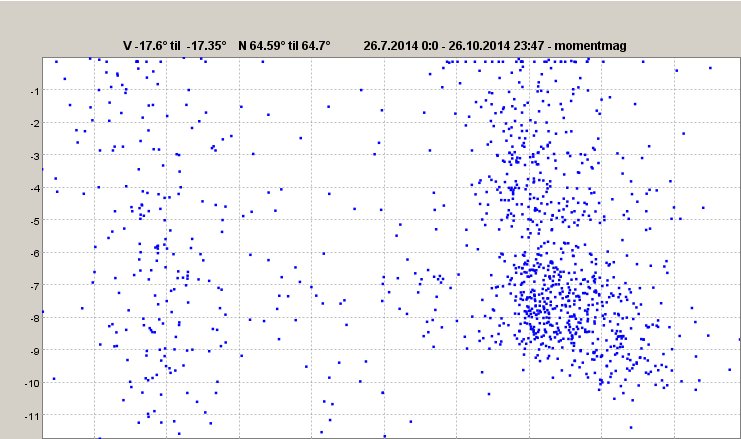
(Credit: Veðurstofan)
Here's how the north cluster and the south clusters align west-east:

(Credit: Veðurstofan)
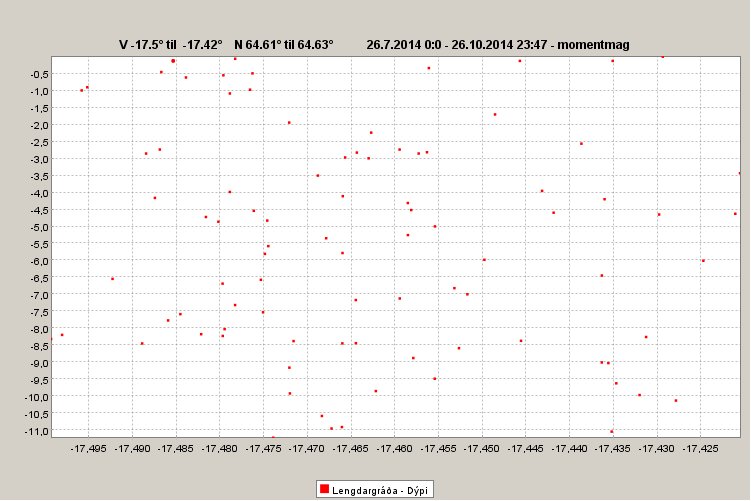
(Credit: Veðurstofan)
And here's what all of the quakes on the western side look like:
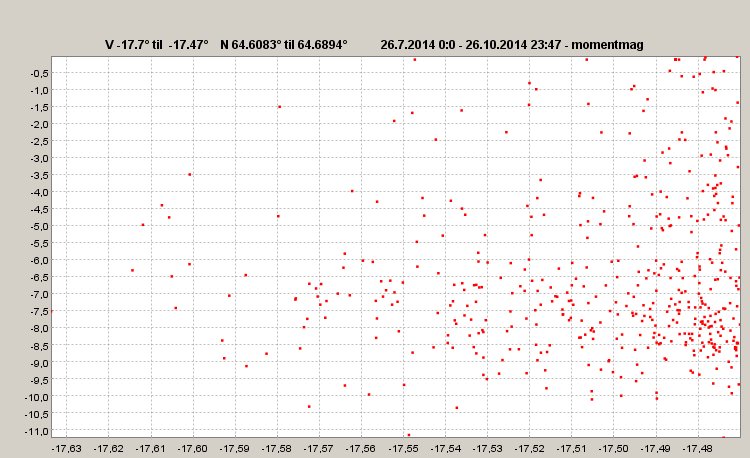
(Credit: Veðurstofan)
So we can see that the deeper quakes tend to be northward of the shallower quakes. The quakes in the north tend to be further west with depth, while the quakes in the south are possibly (although it's not clear) further east with depth. Quakes in the far west are all deep. Quakes in the south extend deeper than quakes in the north. And so forth; there are lots of different trends.
(I had actually made a nice infographic for all of this data but I can no longer seem to locate it and nenni ekki to make it again. :Þ Maybe next time)
I've followed this for a good while but only recently managed to get some more information about it. I contacted Þorbjörg Ágústsdóttir, who most of you know from the earlier interview on this blog, to ask about the trends. Here's what she has to say.
1. One has to be careful when observing trends because you're not just witnessing what's going on, but what the seismic network is capable of detecting. So it's possible that the seismic network can induce biases in where things show up.
2. It's not really known why the vast majority of the activity is on the north side. The best guess would be that this is where most of the subsidence is (she doesn't go into why this would be)
3. She doesn't know why the quakes to the west are all deep, but thinks it'd be interesting to find out.
4. Determining trends in the southeast quake cluster are complicated by the dike; the behavior of quakes in or near the dike may have a different nature than that in the caldera rim. It should also be noted that a good number of ice cauldrons have formed in this area, which we noted earlier on the blog and which have been credited to subglacial geothermal melting or minor subglacial eruptions.
She also pointed out that evidence suggests that the northern end is not only subsiding fastest, but is deepest; this would seem strange, however, given that quakes extend deeper in the southeast.
I asked her a followup as to, if we're seeing distortion due to the density of the seismic network in different areas, why the same trends still show up when you filter by powerful quakes only, which should be visible regardless of the local quality of the seismic network; I have not heard back yet.
As Þorbjörg states, nothing in geology is perfectly symmetric. When you look at the caldera subsidence, it shouldn't be interpreted as a simple plug evenly falling down into an emptying chamber, rather as weaker areas giving way more than stronger areas.
So anyway.. umm... lava?
(Credit: Karolina Michalczewska)
I showed a composite map the other day of the current flow patterns. But I think this version of it (from the same time) shows it better:

(Credit: USGS / NASA)
You can see much better what Þorvaldur Þórðarson describes as the flow being "dammed to the north" and thus having to find a new way to break out to new places.
An interesting issue raises its head again: how fast is the lava being emitted? The issue is clear as mud. Þorvaldur Þórðarsson says (contrary to what we were hearing the other day) that flow rates are not declining at all, and that he believes this eruption will consequently go on for a long time, as the eruption won't stop until emission rates go below 3 cubic meters per second. But then he states current flow rates are "50 to 100 cubic meters per second, depending on how it's calculated". This figure is way lower than that of the last scientific committee report, which has continued to report unchanged flow rates and whose last estimate was 230-350 m³/s.
What's going on here? Are we seeing actual changes in flow rates? Honestly, I don't believe so; rather, all of this contradictory data (flow rates in decline or stable? Flow rates 230-350 m³/s or 50-100 m³/s?) are rather differences in opinion among different experts on how to interpret the available data. I personally tend to follow consensus views more than individual views and would thus defer more to the scientific committee reports, but it's possible that others' perspectives are more accurate.
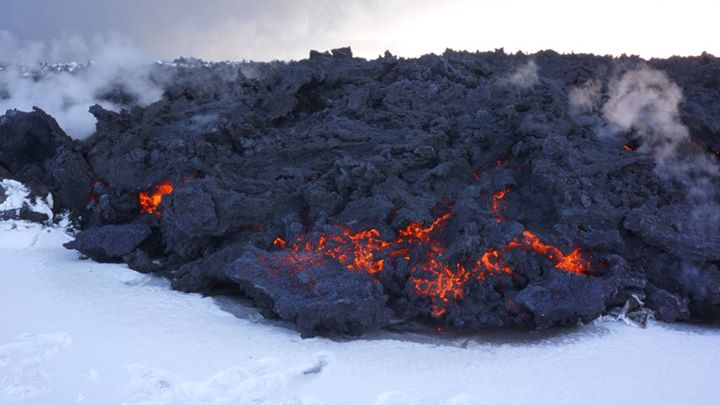
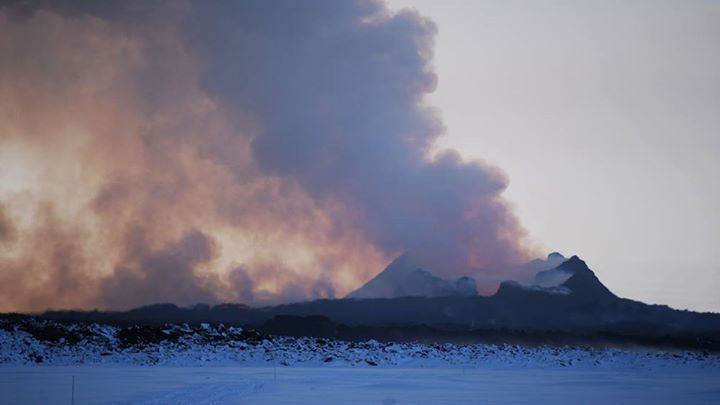
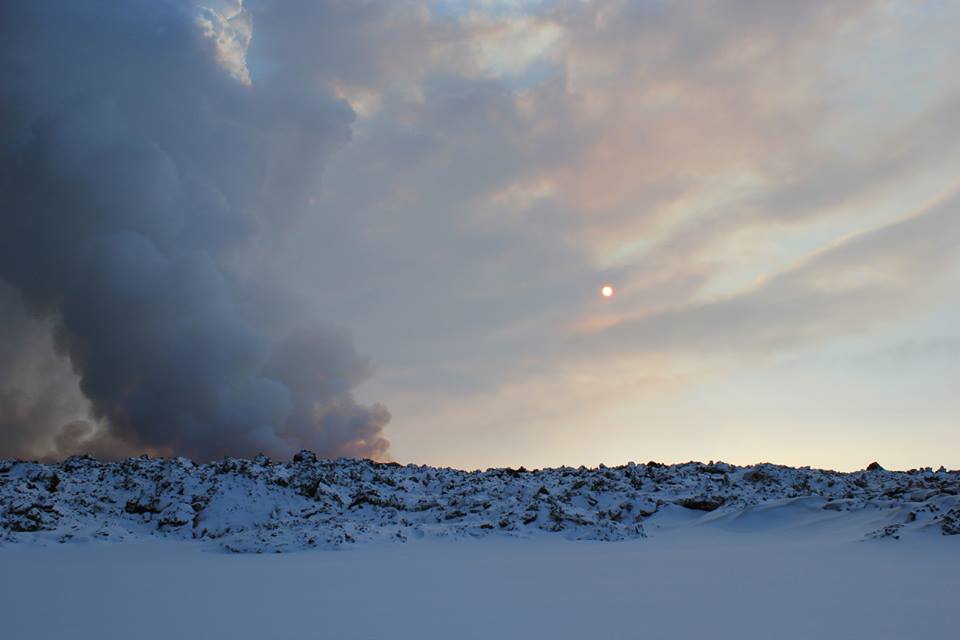
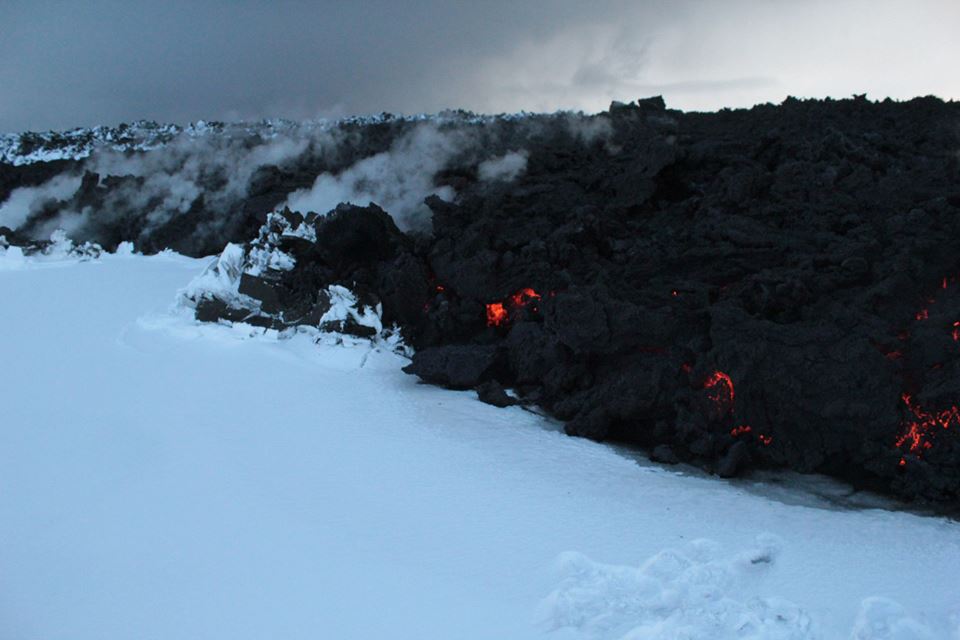
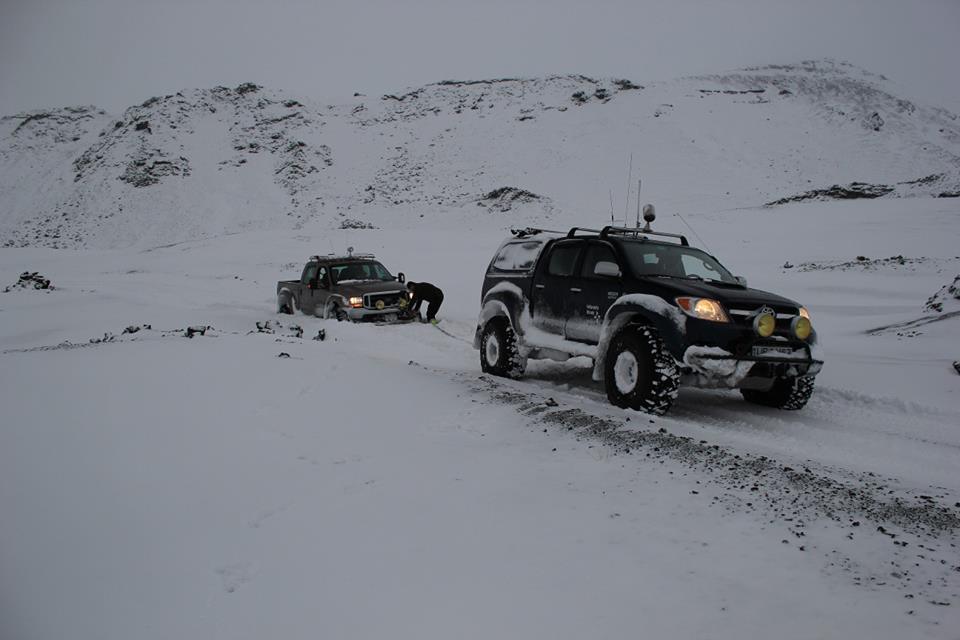
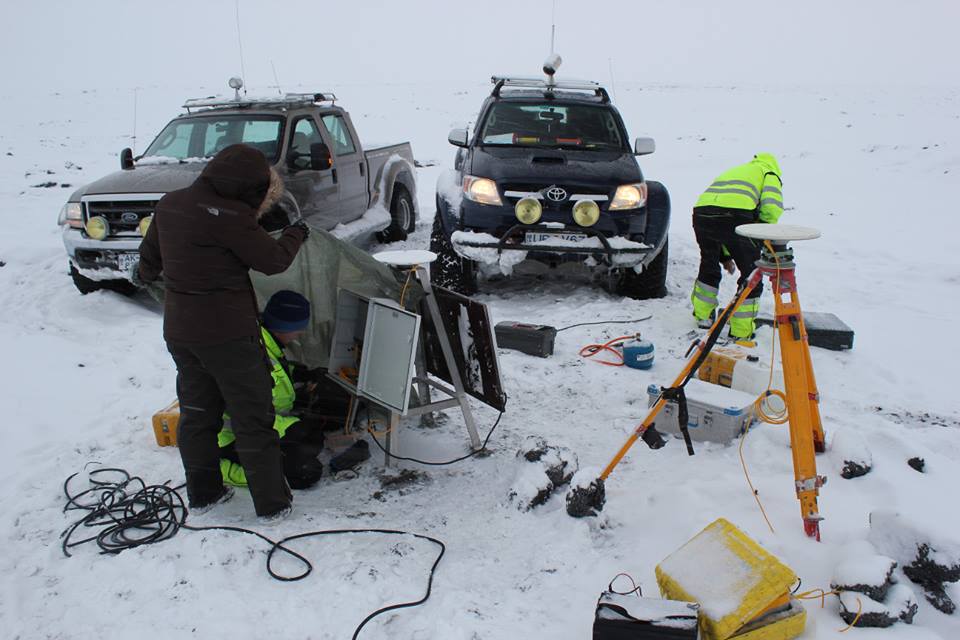
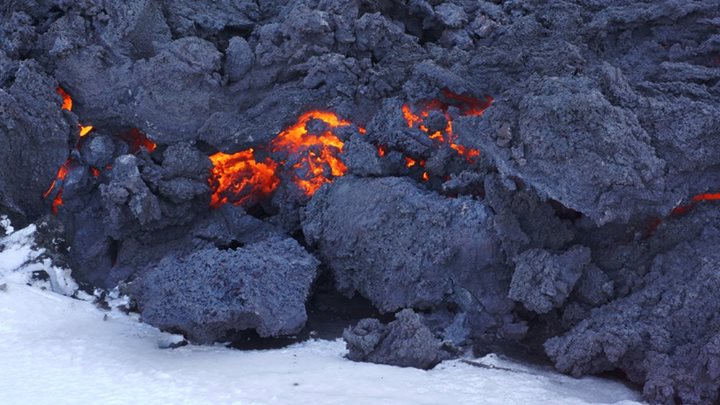
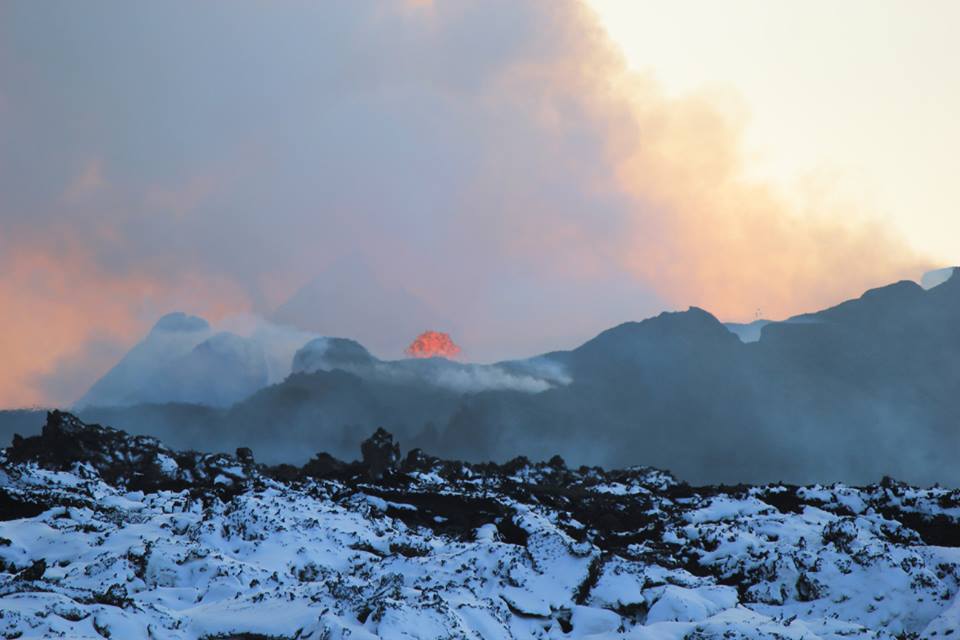
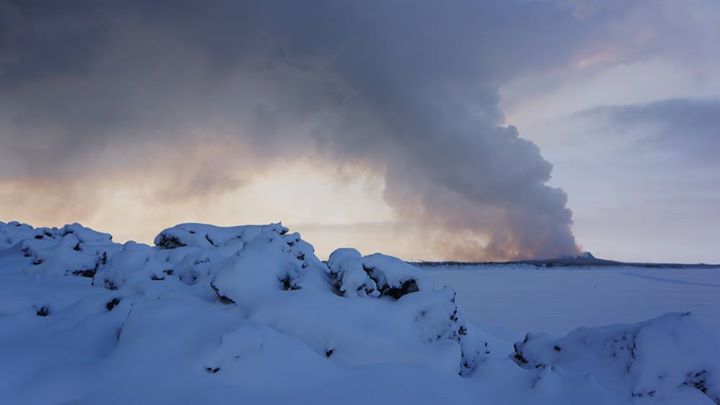
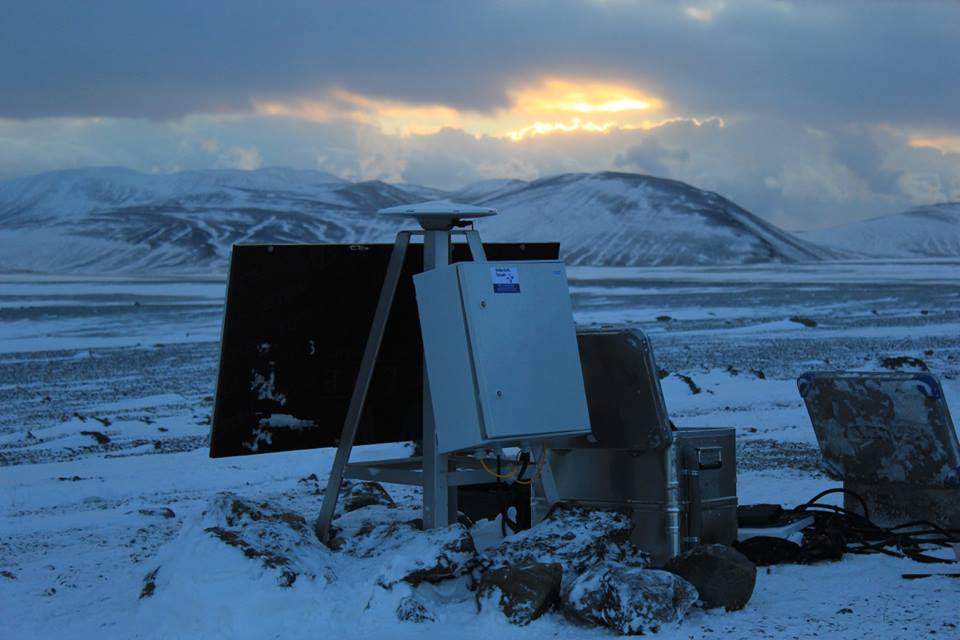
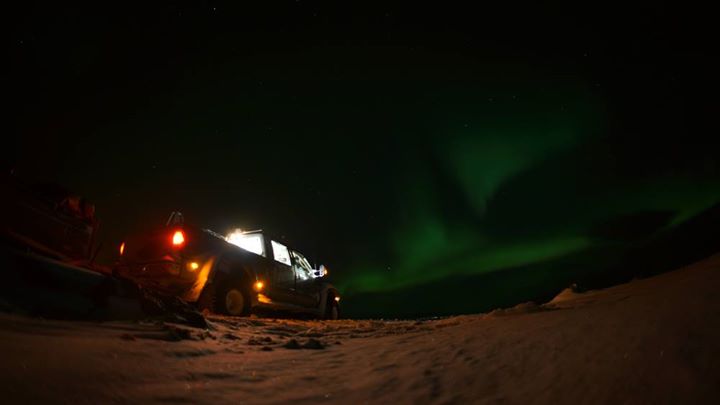
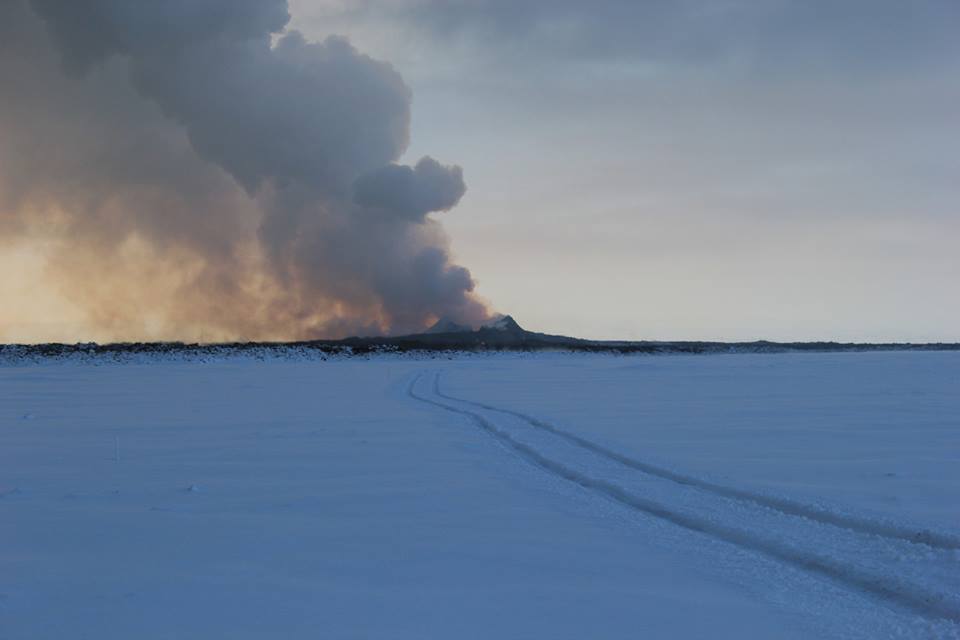
Regardless... picture time. This time it's vehicles getting stuck trying to set up seismic equipment and lava rolling across the snow. Enjoy. :)
(Credit: Karolina Michalczewska)
(Credit: Ronni Grapenthin)
(Credit: Ronni Grapenthin)
(Credit: Ronni Grapenthin)
(Credit: Ronni Grapenthin)
(Credit: Karolina Michalczewska)
(Credit: Ronni Grapenthin)
(Credit: Karolina Michalczewska)
(Credit: Ronni Grapenthin)
(Credit: Karolina Michalczewska)
(Credit: Ronni Grapenthin)

(Credit: Ronni Grapenthin)
