This is the next in a quasi-weekly series of diaries on the Northern Hemisphere Arctic sea ice melt season. I write these in memory of Johnny Rook, who passed away earlier this year. He was the author of the blog Climaticide Chronicles.
Let's start off with a picture from the NOAA north pole drift buoy camera from 25July at about 12 UTC (that's the time at the 0° longitude meridian, near London, UK, the centre of the world at the time this was decided).
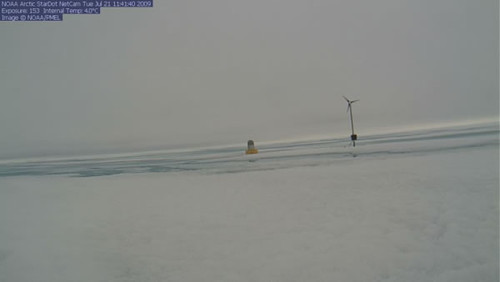
Still cloudy, temperature about -1°C. Still some indication of open water or at least melt ponds. See below for current conditions, and a bit on a new report from the National Snow and Ice Data Center (NSIDC).
UPDATE on 27 July 2009: Ice disappearing quickly over the last 10 days
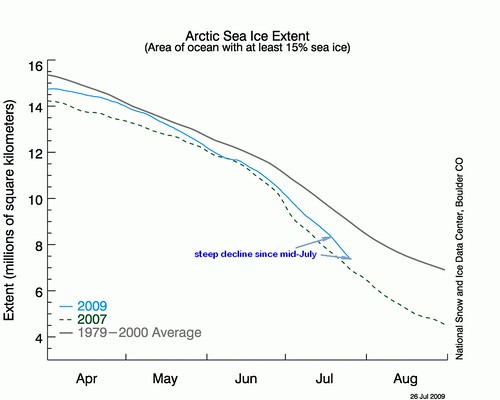
Above is the sea ice extent advanced an additional 2 days. Ice has been disappearing quickly since mid-July ... no upward adjustment yet.
End update
------------------------------------------------------------------------
Conditions over the 25 July 2009 weekend
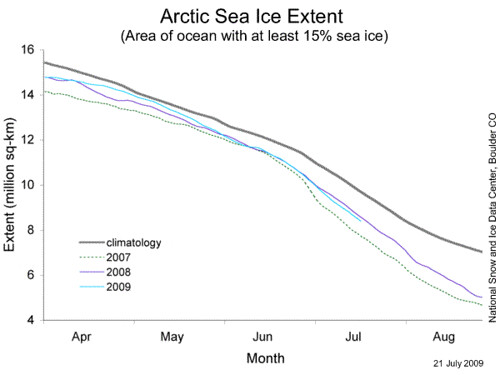
This is the time series of the sea ice extent in the northern hemisphere from 1 April to end of August for 2007 and the 1979-2000 mean (km2), and the current ice melt season through 24 July 2009.
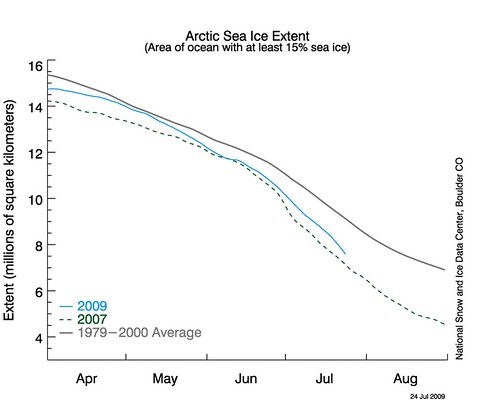
Note that the rate of melt according to the time series has increased recently, and the extent is approaching the level of 2007 at the same time in the 2007 melt season. This looks alarming, but I've seen these time series trajectories get adjusted upward or downward as more days' data comes in. The next few days to a week should tell us if this trend will continue.
In the meantime, what areas are contributing to the decline in ice extent? The graphic below is annotated with areas of concentration decrease enclosed in white and concentration increase enclosed in blue. Much of the decrease has been north of Asia, going counter-clockwise from the right, in the Kara, Laptev, and Chuckchi Seas. The Northwest Passage also lost a bit more ice, with a reduction in concentration where the ice remained.
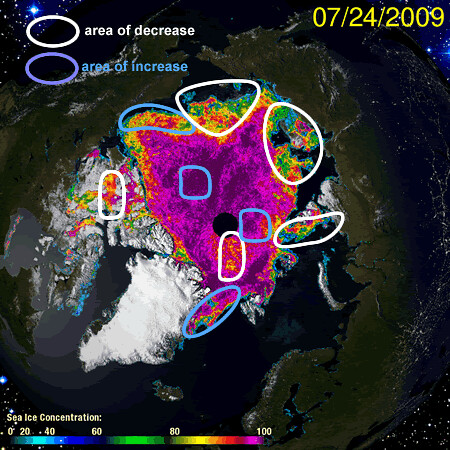
Increases in ice were east of Greenland, along part of the ice edge north of AK and the Yukon/Northwest Territories of Canada, and scattered areas within the sea ice coverage itself, likely the result of wind-driven convergence and divergence of ice rather than extensive refreezing, as temperatures were near or above 0°C over at least the part of the Arctic Basin that was observed. See the image below from the University of Cologne, Germany showing weather in the Arctic at 12 UTC 25 July 2009.
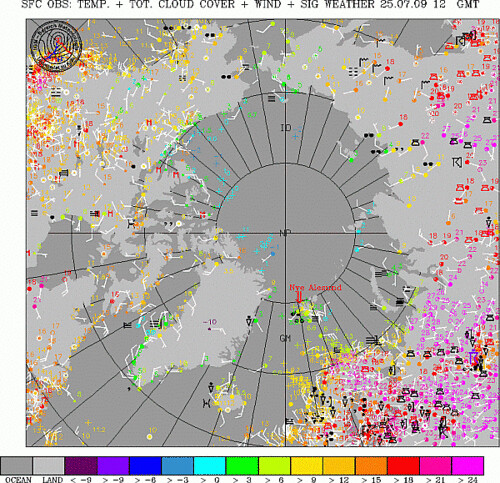 ]]
]]
New Report from NSIDC, 22 July 2009
It's not typical for a mid-month report to be issued, but the NSIDC issued one this month regarding the current year sea ice extent compared to last year. We're sitting slightly below 2008, as can be seen in the graphic below from 21 July.
Below is a 4 panel graphic showing date of melt commencement. Upper left is climatology over 1979-2000 period from satellites, then upper right is 2007, lower left 2008, and lower right the current year, 2009. Colors go from red for melt starting on 1 March through the spectrum to black for melt commencement after 19 July.
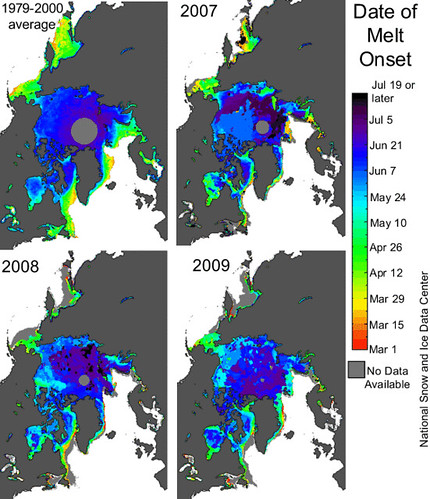
The first thing one notices actually is less the dates of melt indicated by the shading, and more the loss of sea ice along the margins relative to the average. This is really obvious north of Russia and western Siberia, around Greenland, and east of Labrador in Canada (Davis Strait). Then looking at the concentrations, one sees less blue and more green colors in the Beaufort, Chukchi and Kara seas. In some regions such as the East Greenland and the Barents seas, melt began more than two weeks earlier than usual.
