It's already well established that Rasmussen polls are consistently to the right of other polls, and this is often explained in terms of legitimate differences in methodological minutiae.
However, looking at the a large database of Rasmussen polls, it seems that their pro-republican bias, or House Effect, is not monolithic. There seems to be evidence that Rasmussen's house effect is much larger when Republicans are behind, and that it appears and disappears quickly at different points in the election cycle.
See graphs and more below the fold or at StochasticDemocracy.com
***Cross-posted at StochasticDemocracy***
Rasmussen polls are consistently to the right of other polls, and this is often explained in terms of legitimate differences in methodological minutiae.
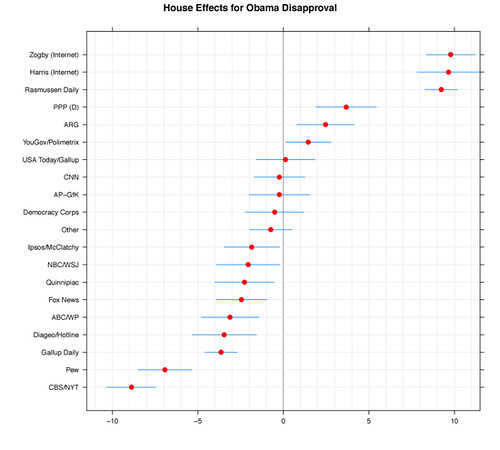
Deviation from average of Obama Disapproval from Pollster
But there seems to be evidence that Rasmussen's house effect is much larger when Republicans are behind, and that it appears and disappears quickly at different points in the election cycle.
In order to estimate "instantaneous" house effect, we looked at all the Rasmussen 2008 polls(Senate, House, Governor, etc), and compared them with the filtered best estimate for public opinion on that day using pollsters excluding Rasmussen.
I'll hold off commentary for now, because these findings are preliminary, other then to say that House Effects seem to be more subtle then previously assumed, and that it warrants more study.
Note: All graphs are in terms of Republican Two-Way vote, defined as RepublicanVote/(Democratic Vote+RepublicanVote), as is standard in political science. "Margins", or RepublicanVote-DemocraticVote, are about twice TwoWay.
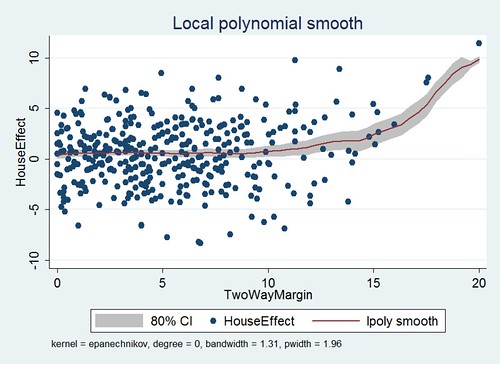
Estimated Rasmussen House-Effect vs "Closeness of race", defined as Abs(50-TwoPartyvote), estimated from all available pollsters excluding Rasmussen. This tests the idea that Rasmussen polls are reliable for close races, but that there is more ambiguity in non-competitive races. There seems to be a trend here, but the absolute value masks something...
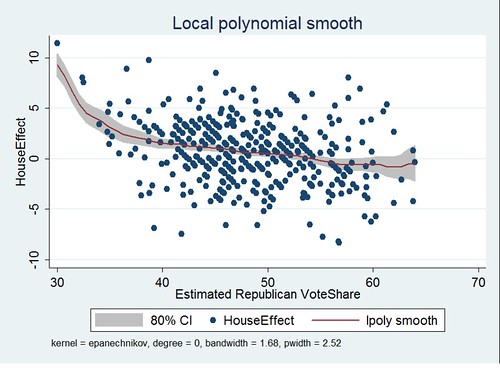
Estimated Rasmussen House-Effect vs Estimated Republican vote from all non-Rasmussen Pollsters. The graph seems to show that Rasmussen House effects are much larger in races where democrats show large leads, making democratic-leading races seem closer then they really are. The effect is not symmetrical.
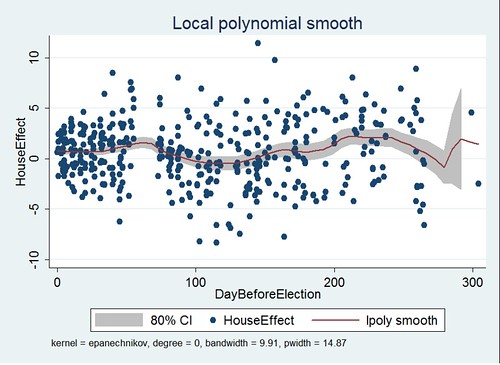
Estimated House Effect vs Days before the Election.
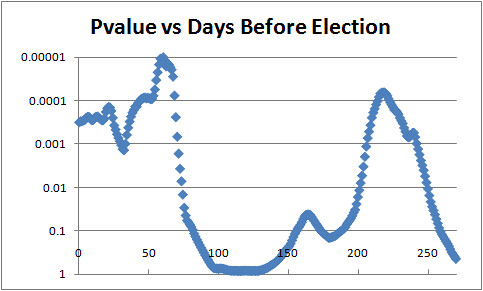
P-Value for "Rasmussen House Effect is greater than 0" over time. The graph seems to show Rasmussen polls have a Statistically significant Pro-Republican house-effect that appears during primary season in the beginning of the year, disappears during the summer, and then very rapidly appears right before the Republican National Convention
The findings are preliminary, my next post will expand the dataset to other elections and run the same procedure on Dailykos/R2K and SUSA polls as a control.
In the meantime, I'm looking for explanations or mechanisms that could explain the patterns above, because I don't see how they can be explained in terms of different voter screens...
Update 3/2 : Some people have noted that the three leftmost points on the second graph obscure the general effect. So I removed the "outliers" and reran the local regression. Here are some graphs:
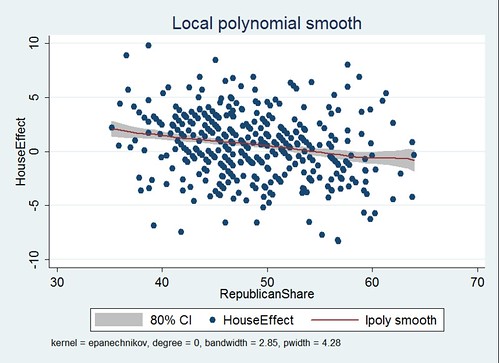
Estimated Rasmussen House-Effect vs Estimated Republican vote from all non-Rasmussen Pollsters with outliers removed
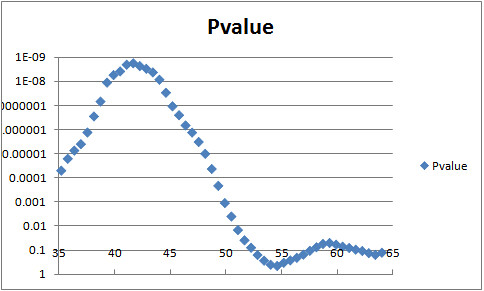
P-value for "House Effect is significantly different from zero" for each point on the previous graph.
