This is the next in a series of diaries on the state of Arctic sea ice (and other topics as warranted) in memory of Johnny Rook, who passed away in early 2009. He was the author of the Climaticide Chronicles.
The National Snow and Ice Data Center NSIDC issued its July 2010 report on 4 August 2010. I'll start with the news therein. Then, I'll show you what's been happening since 31 July in weather and sea ice, hopefully through 6 or 7 August, if the data is updated promptly. Finally, I'll have a few comments on how I expect things to pan out for the rest of the melt season.
More below.
July 2010 Arctic Retrospective
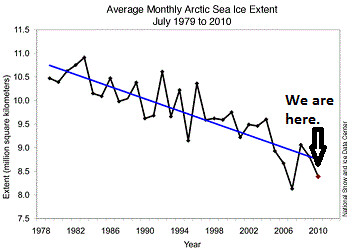
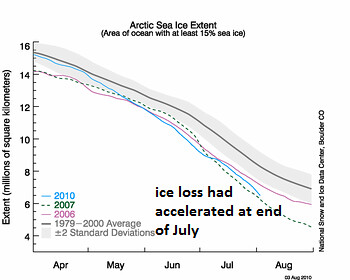
Despite the cool, cloudy weather that developed over much of the Arctic at the beginning of July 2010, the mean monthly Arctic sea ice extent for the month was the second lowest in a record going back to 1979. The rate of decline per day during the month was slightly below average at 77,000 km2 (average is 86,000 km2). This is shown in the following two graphics.
July mean sea ice extent time series, 1979-2010
1 April through 31 August sea ice extent time series for 2006, 2007, mean and 95% probability band for 1979-2000, and 2010 through 31 July
The NSIDC did an analysis of sea ice age and whether the old ice would make it through the 2010 melt season. Last winter, the atmospheric circulation moved the old ice (3 years and older) up against the North American continent westward and southward into the Beaufort Sea north of AK, as reported by them last April. At the end of July 2010, the sea ice age analysis indicated that this ice is melting, as shown in the graphic below.
Arctic sea ice age, 31 July 2010
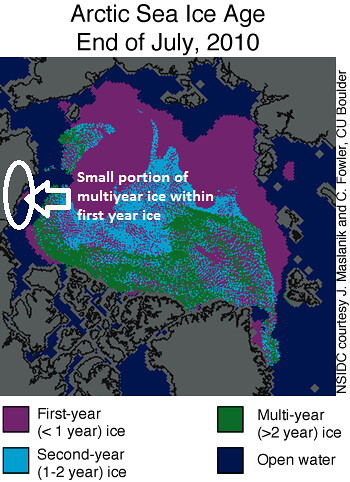
Back in the 1970s and 80s, this ice would not disappear during the summer melt season, after circulations like those in 2010. This year, however, the old ice has been melting. Very old ice that was grounded against the shoreline near Barrow AK, for example, has essentially vanished. I've circled that area in the graphic above.
Now check out the satellite photo below, at 250-m resolution.
Visible Satellite Photo near Barrow AK, 25 July 2010, showing separation of multiyear sea ice from the main ice pack
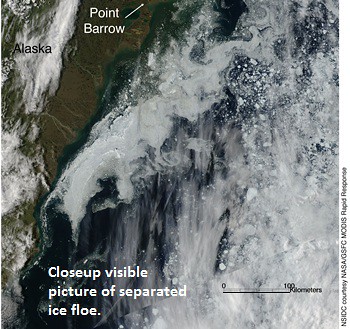
While this ice may not completely disappear because of the current relatively cool weather conditions, the separation of the ice from the main pack makes this much more likely. Other events such as the 100 mi2 iceberg that broke off from Greenland's Petermann Glacier or the record heat wave in Russia may not be individually indicative of global climate change, but all these events and others taken together cannot be simply ignored. (/soapbox)
The Arctic for the week ending 6 August 2010
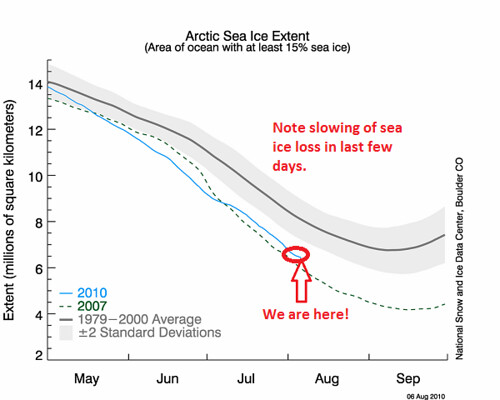
Sea ice loss began the period at a robust pace of slightly over 100,000 km2 between 31 July and 1 August. Ever since, it has been slowing and averaged about 50,000 km2 day the last two days of the period. This can be seen in the graphic below from the NSIDC.
Time series of Arctic sea ice extent, 1 May - 30 September for 2010, 2007 and the mean and 95% probability band for 1979-2000. For 2010, shown through 6 August.
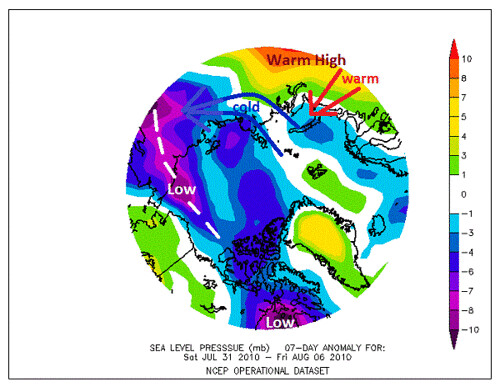
Weather conditions last week once again changed from the week before, becoming cooler and more stormy over the Arctic basin. The mean sea level pressure and surface air temperature anomalies for the period from 31 July through 6 August 2010 are shown in the graphics below.
Mean sea level pressure anomalies, 31 July through 6 August 2010
Mean surface air temperature anomalies, 31 July through 6 August 2010
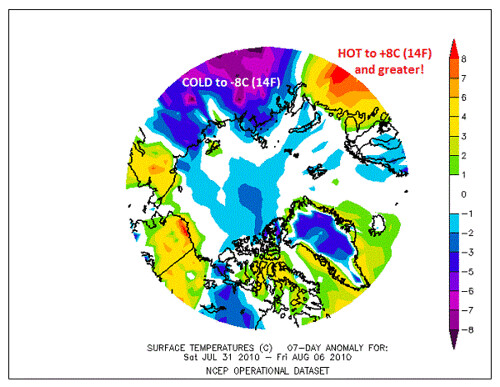
A trough of anomalously strong low pressure extended from eastern Siberia into the Arctic Ocean north of AK and the Northwest Territory of Canada. South of that trough it was warmer than normal, but north and west of it winds blew from the north and it was colder than normal by as much as 8°C (14°F). This also pushed the ice from the Arctic Ocean toward the coast once again, expanding to some degree the coverage in this region. Similar warm anomalies could be found in the part of European Russia north of 60°N. Further south, of course, it was as warm as 102°F in Moscow, the second record highest temperature ever in a week.
What's Next?
I'll place this quote from the July 2010 report from the NSIDC below, verbatim:
Conditions in context
Cool, stormy weather this July has made it less likely that the upcoming 2010 sea ice minimum will set a new record. It would take a very unusual set of conditions in August to create a new record low.
If the daily rate of decline this August follows the average August rate of decline for 1979 to 2000, the daily sea ice minimum in September would be 5.00 million square kilometers (1.93 million square miles), considerably higher than the record minimum of 4.13 million square kilometers (1.59 million square miles) observed for September 16, 2007. A daily rate of decline identical to 2007 would yield a September minimum of 4.43 million square kilometers (1.71 million square miles); while daily decline rates similar to 2008 (the largest ever observed for August), would yield a September minimum of 4.08 million square kilometers (1.58 million square miles). If the daily rate of decline is similar to 2006, the slowest in recent years, the minimum would be 5.27 million square kilometers (2.03 million square miles).
My guess at this point is that we'll come in somewhere between 2008 and 2009's minima. We'll know by mid-to-late September what will verify.
