You may have seen the
NYT article on the affordability of housing in 2005:
The burden of housing costs in nearly every part of the country grew sharply from 2000 to 2005, according to new Census Bureau data being made public today. The numbers vividly illustrate the impact, often distributed unevenly, of the crushing combination of escalating real estate prices and largely stagnant incomes.
I have a few spectacular graphs to illustrate this and, more to the point, how this is about to change brutally, via graphs found in a study prepared by the French investment bank Société Générale (PDF).
First, the affordability index:
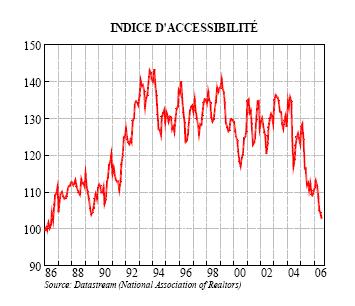
So, a pretty nasty change in trend in the past two years is visible in that synthetic index. But "hard" numbers show even more stunning changes:
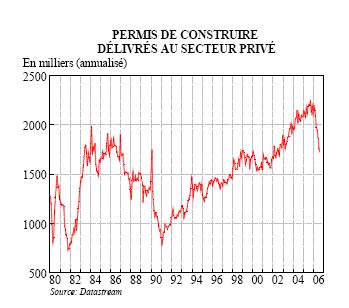
These are construction permits for the private sector, on an annualised basis. Something changed in late 2005...
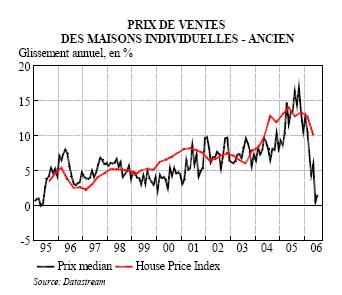
The above is the year-on-year increase in median house prices (black, jerky line) and the House Price Index (red, smoother line). Again, after a tumultuous 2005 when house price increases reached records, the trend has brutally changed, with prices suddenly stabilizing. Again that does not mean that the market has crashed, but the growth trend certainly has.
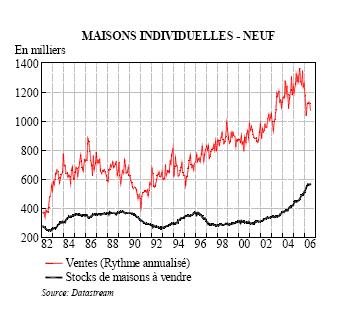
The next graph shows the number of sales of new homes (red) and the stock of such homes available for sale (in black). Again, a nasty break at the end of 2005, and a steadily growing stock, which means that supply is building up at a tiem when demand is drying up. Not a good combination for prices.
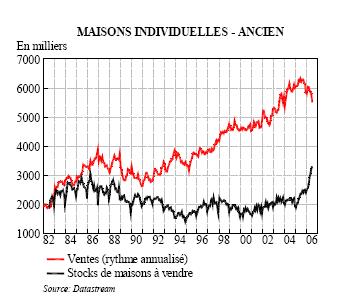
Same thing for second hand homes. The drop in transactions is less brutal, but the increase in stocks much bigger. The combination, again, points to a market switching from being a sellers' market to being a buyers' markets, and to downwards pressure on prices.
Real estate markets don't usually crash immediately. what happens is that transactions stop, as buyers are unable or unwilling to pay the prices asked, and sellers are first unwilling to lower prices, and then unwilling to sell at the expected lower prices. That can take a while before forced transactions bring the market to "visualise" the lower prices; forced transactions being people selling because they no longer can carry the debt burden, or mortgage banks trying to realise repossessed assets when people defaulted on mortgages.
As has been discussed before, many people live in their houses and will not sell, so the loss is virtual for them, but enough bought recently thanks to the very aggressive conditions offered by banks (no principal repayment in early years, loans equal to 100 or 110% of asset value, variable rates) and these loans are going to become increasingly unaffordable as interest rates rise (see graph below) and principal payments kick in (with no capital gains to cushion the shock).
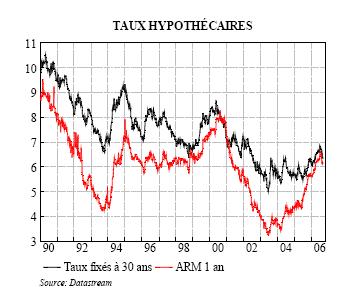
That last graph really tells the tale: the real estate boomed on the back of incredibly low interest rates, whether fixed or variable, but that period is over. However, the debt is still there, and will be an increasing burden for those on variable rates, and price levels will no longer be supported by buyers able to borrow vast amounts ofcheap money. More expensive debt means less debt and thus less purchasing power for house buyers.
Prices have not dropped, but the crash has happened already.
