American consumers appear to be signalling that the US is entering a recession. This has happened only twice since 1980, in the recessions of 1981-2 and 1990-1. The latest available data shows that it is on the verge of happening again for a third time.
I have prepared a simple graph, showing how, when average American consumers have not had an improvement in their incomes, and have been unable to borrow against their existing assets, refinance old debt, or take on new debt, recession has followed. The graph includes income growth, house price appreciation, stock appreciation, interest rate reductions, and the incurring of debt by consumers from 1980 - present. You can see graphically that the average American's household income has not improved since 1999, their 401ks haven't gained meaningfully since 2000, their homes -- the source of borrowing from 2001-2005 -- are now declining in value, and they are unable to refinance at lower interest rates. As a result, they are cutting back on consumption -- signaling recession.
This diary is a revision to an earlier diary entitled "Are Hard Times near? The Great Decline in interest rates is ending." A number of commenters encouraged me to rework the diary and also convert the text table in that diary into a graph. I have now done so and it appears below in several forms.
The starting point for my analysis is pretty simple: suppose you wanted to undertake a significant new purchase. If you didn't have enough money now, you could still purchase it soon if you got a pay increase. If you didn't get a pay increase, you could cash in an asset or borrow against it. If you couldn't do that, you could take out a new loan, or else refinance an old loan at a lower interest rate. If you couldn't do any of those, you might have to cut back in other areas, or else forego the purchase.
The same applies to American consumers as a whole.
First let's look at each source of buying power
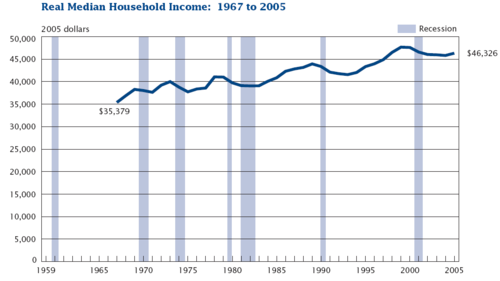
1. Household income for middle and working class Americans have not improved significantly since the 1970s, as recently demonstrated by a joint project of think tanks that incidentally included The Heritage Foundation and the Enterprize Institute, entitled The Economic Mobility Project, which found that:
To be sure, the American economy grew over this period but at a much slower pace than in previous generations. Going back to 1820, per capita gross domestic product in the United States has grown an average of 52 percent for each generation. But since 1973, overall median family income has grown only 0.6 percent per year, a rate that produces a 17 percent increase in the average family’s income for each generation.
as is succinctly shown in this chart:
Thus, the only way American consumers have been able to significantly improve their lifestyles is either to take on debt, using assets which have appreciated in value as collateral, or to refinance their existing debt at lower interest rates. If consumers are unable to tap the value of assets, or to refinance, then without improvements in wages, they will cut back spending. This causes a consumer-led recession. Since 1980, this has only happened twice: in the deep Reagan recession of 1981-82, and again briefly from July 1990 to March 1991.
2. One way consumers can improve their finances is to refinance debt at lower interest rates. In this thesis I have a simple but fundamental disagreement with bonddad. Bonddad argues that because interest rates are modest, they do not pose a problem for the economy. I say that modest interest rates aren't enough; to periodically refinance debt, consumers must have ever-decreasing interest rates.
Interest rates reached their highest level ever in October 1981, when the interest paid to investors buying a 30 year US treasury note was 15.21%, and a 10 year Treasury bond yielded 15.84%. Since that month and until recently, long term rates have at least until recently, almost relentlessly declined:

Notice that interest rates made significant new lows (allowing consumer refinancing) within 3 years of past lows, with the exceptions of 1989-1991 (where interest rates remained above their 1987 lows), 1996-8 (where rates remained about their 1993 lows) 2002-2003 (where rates remained above their 1998 lows), and 2006-present (as to 2003 lows). Additionally, interest rates did not decline to their pre-1980 levels until 1985. Thus, for example, a consumer who took on a new, low-rate mortgage in 1987, may have had to wait until 1993 or later to refinance at a lower rate.
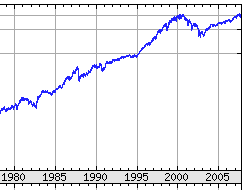
3. If wages do not go up, and interest rates do not decline, there are two other ways for American consumers to obtain cash for purchases: by tapping into stock market gains, or housing appreciation. With the exception of 1990-1, from 1982 until 2000 increasing stock wealth gave those American families who owned shares (for example, via 401k plans) a source of cash:
4. And from 2000 through 2006, stock market gains were replaced with home equity loans (HELOCs) due to a rapid increase in house prices:
5. Because average household wealth has increased meagerly in the last 30 years, Americans have responded by going deeper into debt. The economy expands when consumers take on new debt to buy stuff. When consumers start paying off debt, they buy less stuff. Buying less stuff means the economy contracts. Here is a chart of average total indebtedness, expressed as a percentage of income, for American households:

Notice how after 1980, consumers pulled back on debt until about 1984, and again from 1987 through about 1993.
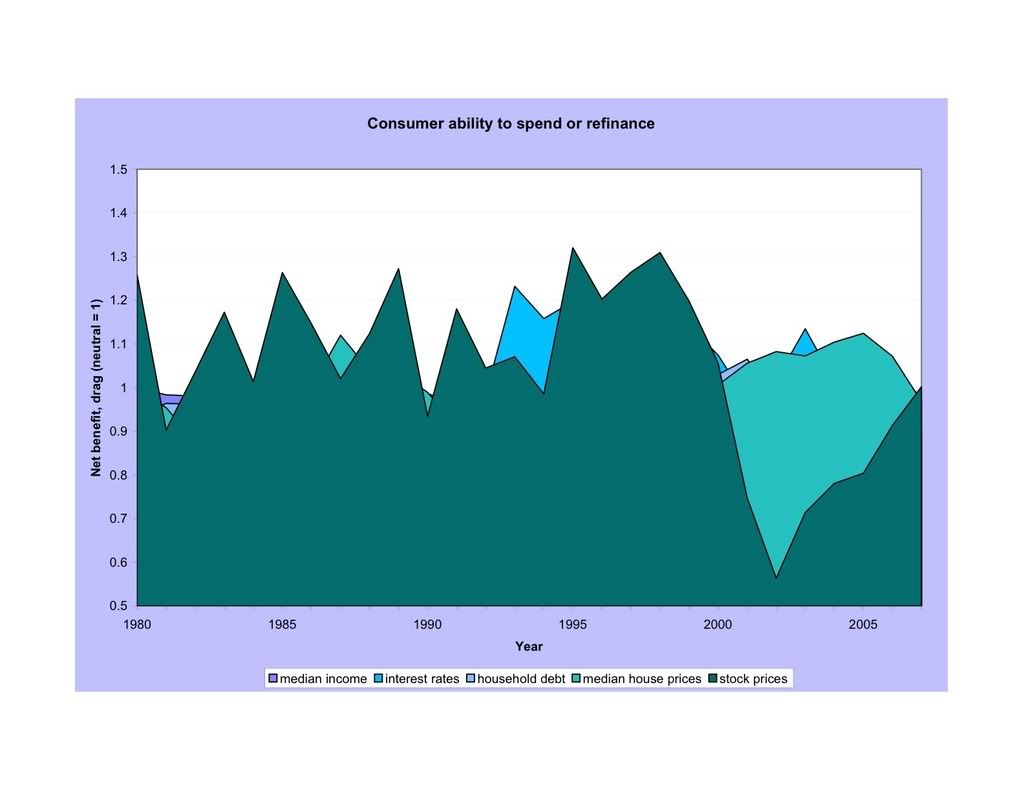
Putting all of this information together into a simple graph
American consumers:
- have not had an increase in household wealth
- have been unable to refinance at lower interest rates for more than 3 years
- have been unable to tap into increased wealth via stock or house price appreciation above previous levels
- and have chosen instead to cut back significantly on debt (more than 1/2%)
only twice in the last 27 years: during the recessions of 1981-2 and 1990-1. All of the above information is put together in the graph I have created which appears below. In the graph, values greater than 1 show the percentage increase in household income, stock prices, home prices (all adjusted for inflation), and new debt over previous highs; and the percent of decreases of interest rates to new lows. In short, a value above 1 is good. It means the consumer can buy more stuff and the economy can expand.
Contrarily, values less than 1 show the percentage decrease of income, stocks, house prices, and debt from past high levels; and the increase of interest rates from previous lows. Values less than 1 mean the consumer has had to retrench and buy less stuff. The economy will contract.
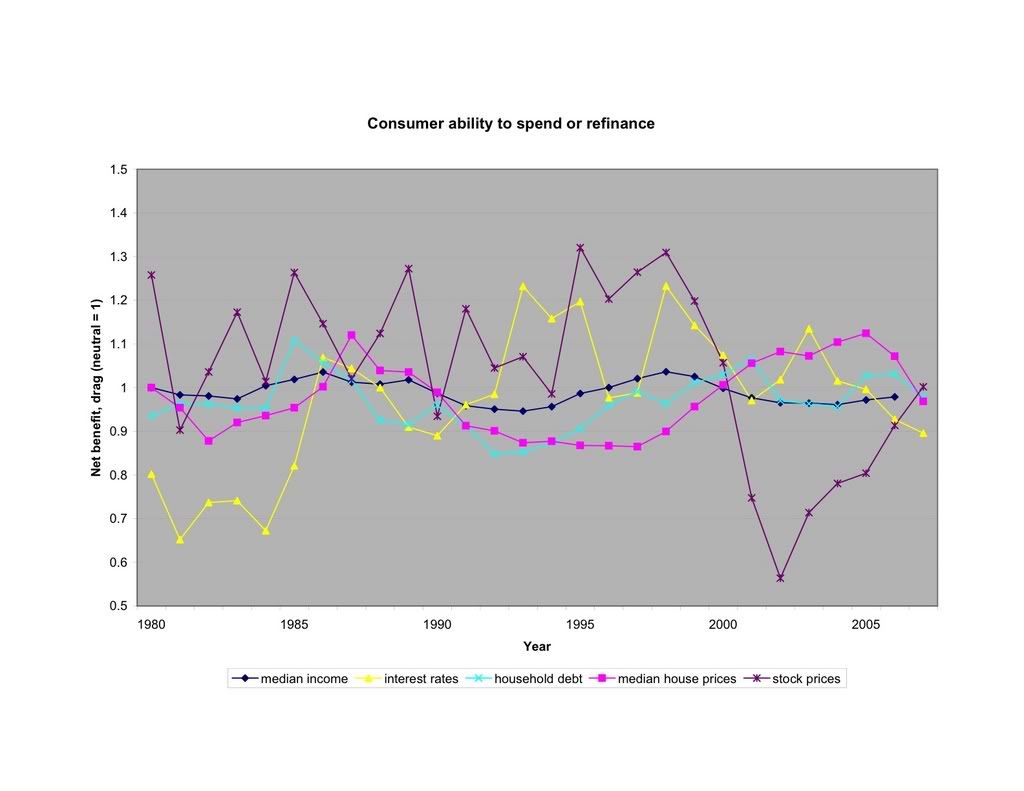
You can (hopefully, since the horizontal axis lines are faint) see that all 5 values are less than 1 only twice before now: in 1981 and 1990 at the onset of recessions. A third time, during the economic slowdown of 1984, the values came close, but stock prices and incomes were positive.
Here's another view of the same data, perhaps better showing that none of the values exceeds neutral, a low reading not seen except for the recessions of 1981 and 1990:
At present, household income is still below 1999 levels as of the last report (for 2006). Interest rates have not receded to their 2003 levels, so refinancing activity cannot increase. House prices are in marked decline. Consumers have cut back, albeit not yet that significantly (as of June 30, 2007), on debt. Only stock prices, by the barest of margins (.02%), are positive. In order to avoid a recession, house price declines must stop, stock market gains must accelerate, or household income must increase significantly. Failing at least one these three things, if households have continued to cut back on debt, as appears likely, America will probably enter (or may already have entered) only its 3rd consumer recession since 1980.
