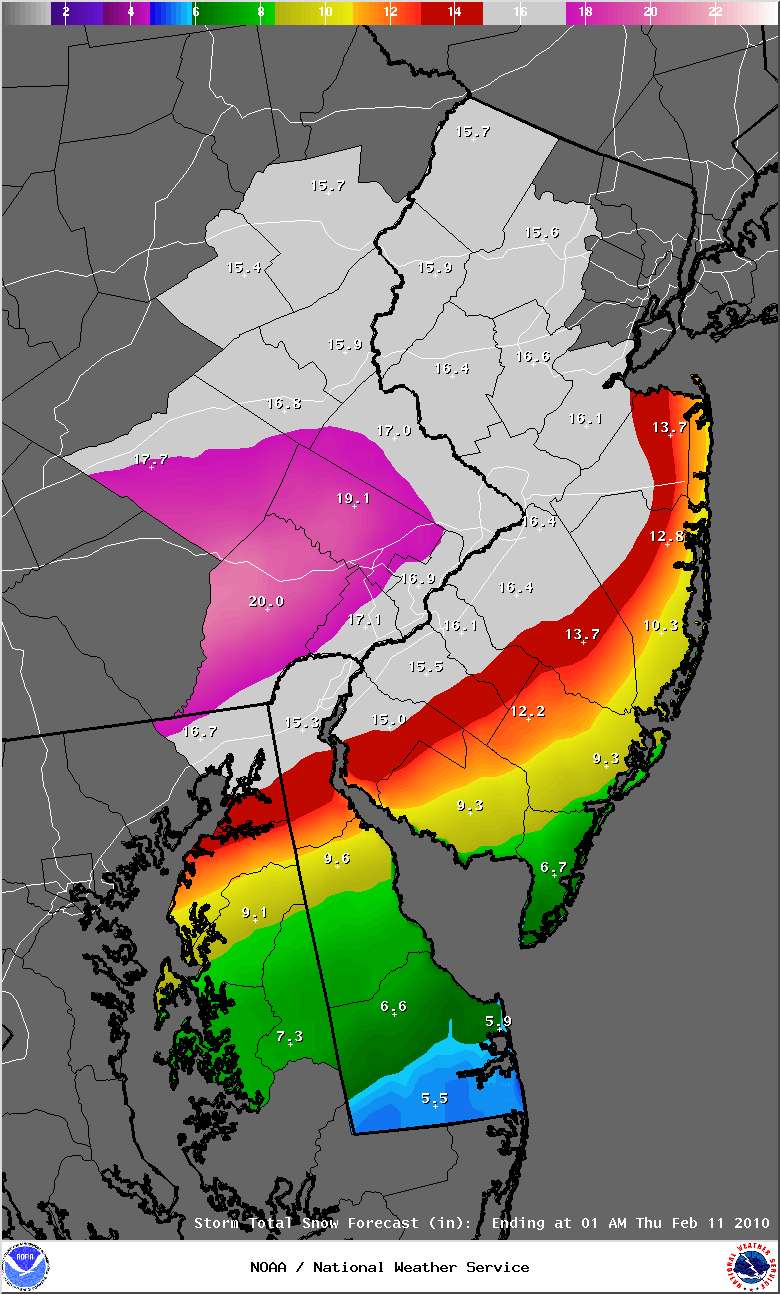
Ten to twenty more inches of snow are forecast for the mid-Atlantic region following the record breaking storm of February 5 and 6, 2010. The latest official forecasts predict the largest amounts, over 20 inches, will fall near Philadelphia.
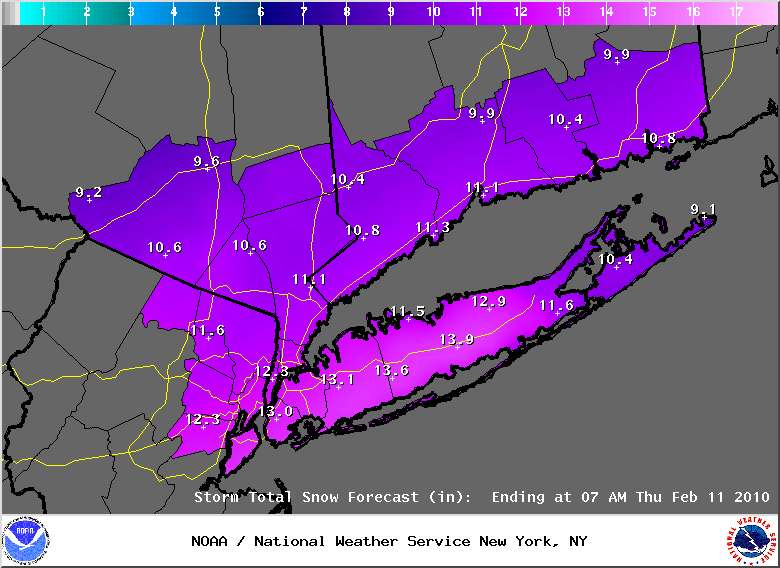
Over a foot of snow is forecast for New York city and Long Island.
Multiple weather models show explosive development of the storm tonight when the low pressure area tracks over the Gulf Stream. Exceptionally rapid uplift of the warm humid air over the Gulf Steam tonight is predicted to cause the storm to develop rapidly while it produces heavy precipitation.
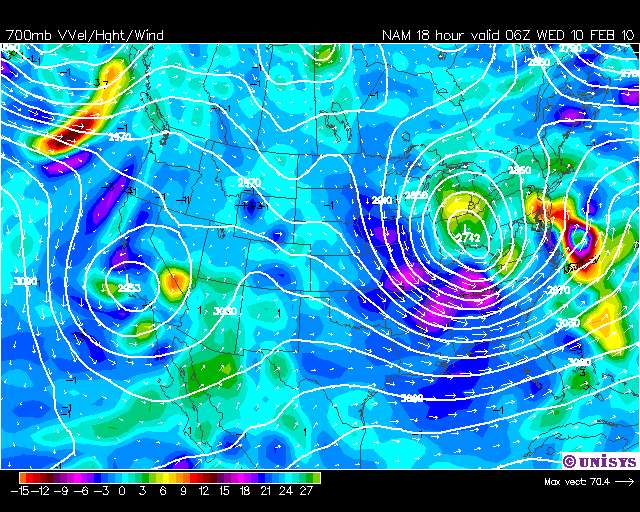
Because the Gulf Stream is running north of its normal position at warmer than normal temperatures, more energy (and water vapor) is available to fuel the storm.
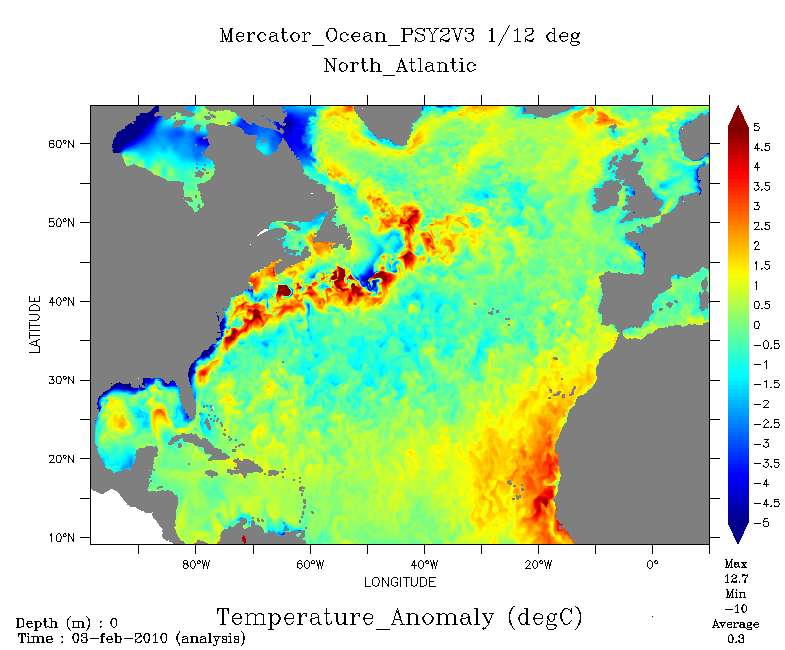
Weather models are not in agreement over the amounts of snow that will hit eastern Massachusetts. Stay tuned for updates. The weather services models, which are the most reliable predict less snowfall in eastern New England than in Philadelphia. The Navy model, however, would give eastern New England massive snow amounts if it validates.
"Snowmaggedon" the record breaking storm of February 5 - 6, 2010
In Howard County, Maryland accumulations of snow greater than 3 feet were reported. Colesville, Maryland reported 40 inches - over 1 meter of snow.
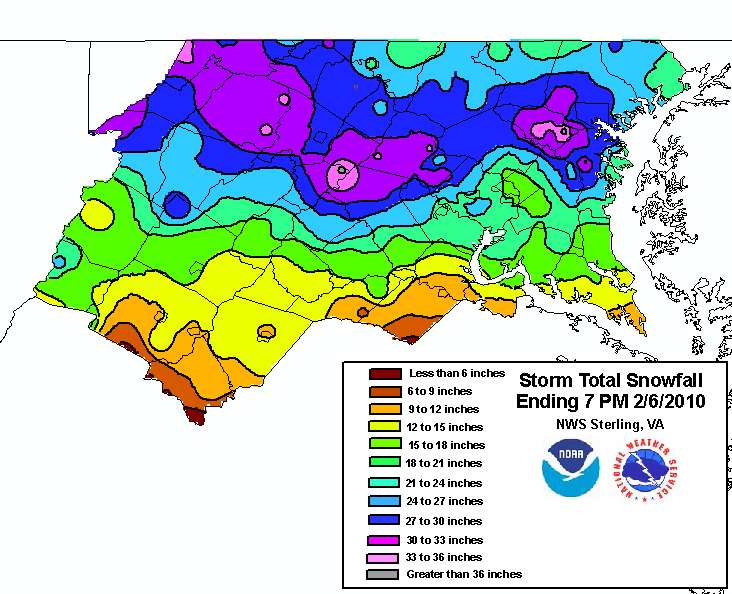

In Howard county, between DC and Baltimore snow depths averaged over 30 inches.
"Snowmaggedon" was in the top 5 heaviest snows for Baltimore, Washington, DC and Philadelphia.
Top 9 snowstorms on record for Philadelphia:
- 30.7", Jan 7-8, 1996
- 28.5", Feb 5-6, 2010 (Snowmageddon)
- 23.2", Dec 19-20, 2009 (Snowpocalypse)
- 21.3", Feb 11-12, 1983
- 21.0", Dec 25-26, 1909
- 19.4", Apr 3-4, 1915
- 18.9", Feb 12-14, 1899
- 16.7", Jan 22-24, 1935
- 15.1", Feb 28-Mar 1, 1941
The top 10 snowstorms on record for Baltimore:
- 28.2", Feb 15-18, 2003
- 26.5", Jan 27-29, 1922
- 24.8", Feb 5-6, 2010 (Snowmageddon)
- 22.8", Feb 11-12, 1983
- 22.5", Jan 7-8, 1996
- 22.0", Mar 29-30, 1942
- 21.4", Feb 11-14, 1899
- 21.0", Dec 19-20, 2009 (Snowpocalypse)
- 20.0", Feb 18-19, 1979
- 16.0", Mar 15-18, 1892
The top 10 snowstorms on record for Washington, D.C.:
- 28.0", Jan 27-28, 1922
- 20.5", Feb 11-13, 1899
- 18.7", Feb 18-19, 1979
- 17.8" Feb 5-6, 2010 (Snowmageddon)
- 17.1", Jan 6-8, 1996
- 16.7", Feb 15-18, 2003
- 16.6", Feb 11-12, 1983
- 16.4", Dec 19-20, 2009 (Snowpocalypse)
- 14.4", Feb 15-16, 1958
- 14.4", Feb 7, 1936
The best source of imagery to see how the Snowmageddon storm developed is the CIMSS satellite blog. The first satellite image, a large animated gif, shows the movement of atmospheric moisture, in the water vapor channel. In the satellite movie, an intense upper level low moves from the Pacific into Baja California bringing much needed rain to the drought stricken southwestern deserts. The upper atmospheric wave moves over the Gulf of Mexico, pulling in tropical moisture in a long band that originates in the El Nino warmed tropical eastern Pacific ocean. A surface low develops from the strong atmospheric wave moving from Texas to the Gulf of Mexico then up into the Ohio valley. The strong upper atmospheric wave then develops a new surface low off of the Carolinas.
Then Snowmaggedon storm "bombed" when it tapped into the energy of the further north and warmer than normal Gulf Stream water. See Capitalclimate blog.
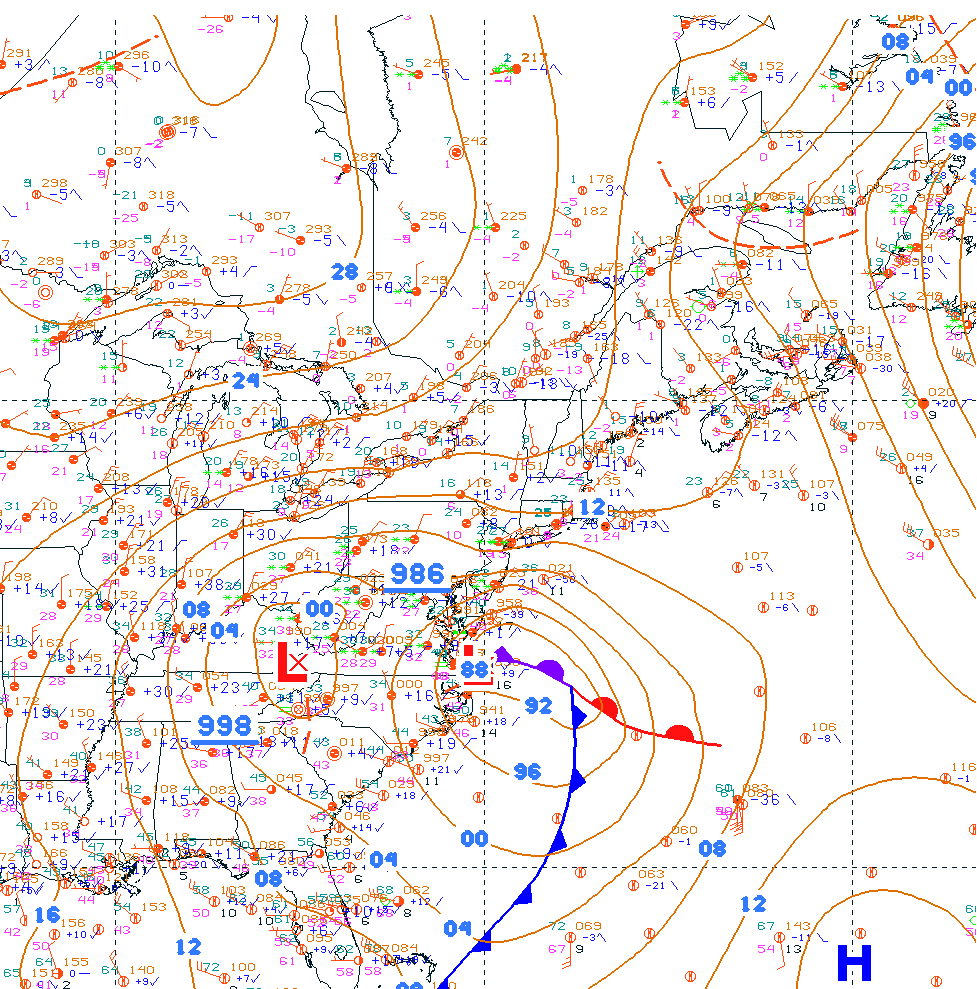
From my perspective the most interesting CIMSS satellite movie of Snowmageddon is the combined water vapor and lightning imagery. Click to watch the satellite image movie. At one point, apparently when the cold front hits the Gulf Stream, off of the Virginia capes a tight surface low explodes with lightning strikes. I screen captured this feature in the GIF movie.
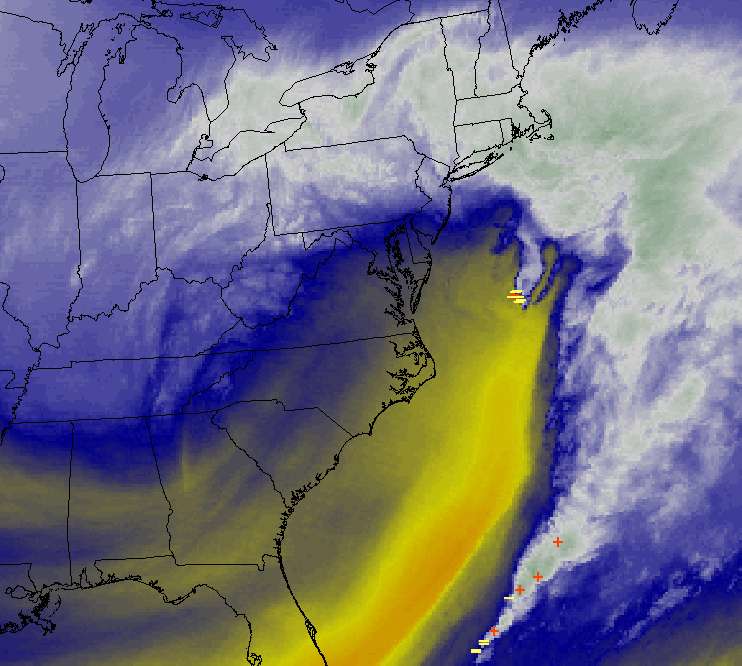
The image shows that water vapor was moving from the Gulf Stream back towards Ohio. Snow fell from New Jersey to Missouri from the very long flow of easterly winds. The extended flow of easterly winds over the mid-Atlantic region for many hours gave the time needed to produce exceptional amounts of snow.
Dr. Jeff Masters, meteorologist, notes in his blog that the occurrence of two 100 year snow storms in Philadelphia in one winter is very improbable. And now we might get the third 100 year snow if the weather service's forecast is accurate.
Philadelphia has had two snowstorms exceeding 23" this winter. According to the National Climatic Data Center, the return period for a 22+ inch snow storm is once every 100 years--and we've had two 100-year snow storms in Philadelphia this winter. It is true that if the winter pattern of jet stream location, sea surface temperatures, etc, are suitable for a 100-year storm to form, that will increase the chances for a second such storm to occur that same year, and thus the odds have having two 100-year storms the same year are not 1 in 10,000. Still, the two huge snowstorms this winter in the Mid-Atlantic are definitely a very rare event one should see only once every few hundred years, and is something that has not occurred since modern records began in 1870. The situation is similar for Baltimore and Washington D.C. According to the National Climatic Data Center, the expected return period in the Washington D.C./Baltimore region for snowstorms with more than 16 inches of snow is about once every 25 years. This one-two punch of two major Nor'easters in one winter with 16+ inches of snow is unprecedented in the historical record for the region, which goes back to the late 1800s.
Discussion of Possible Causes of this Winter's Extreme Mid-Atlantic Winter Storms
Multiple factors have caused the conditions that led to these exceptional snow storms.
- El Nino
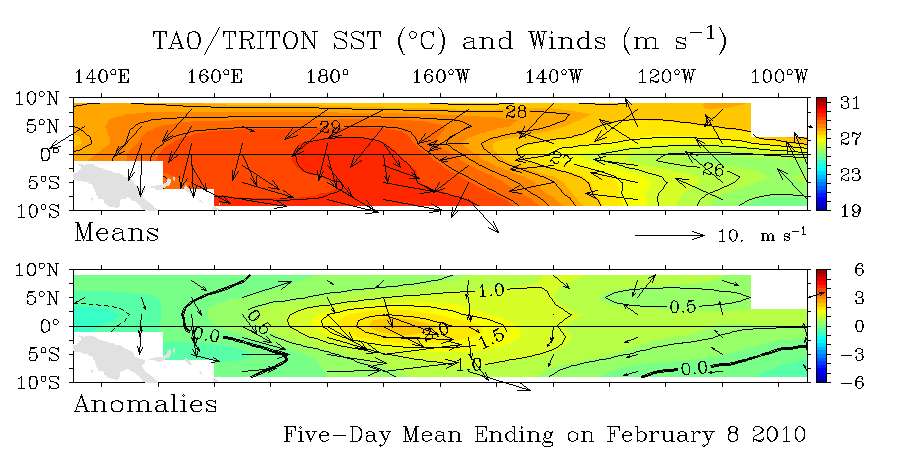
In El Nino years the trade winds weaken over the tropics while the westerly winds and the storm tracks move south. Westerly winds in the western Pacificstrengthen the flow of warm water that built up in the western Pacific when the trades were strong, back towards the Americas. This warm water combined with the southerly storm track leads to wet stormy winter weather from California to Texas to the Carolinas.
- The Arctic Oscillation
Warm air and high pressure over Greenland has diverted the storm track into the mid-Atlantic and into the Labrador sea. The strong storms in the Labrador sea are pulling cold Canadian air into the east coast on their back sides. A very strong storm that moved from the mid-Atlantic into the Labrador sea preceded the Snowmageddon storm. Cold air and high pressure over New England blocked it from moving up the coast. Many large mid-Atlantic storms are associated with lows near the Labrador sea.
- Climate Change
Some "conservatives" are interpreting this winter's extreme weather as an opportunity to claim that global warming isn't happening while simultaneously attacking president Obama.
This is the first time since record keeping started that two storms of such magnitude have hit the region during one winter. Already some localities are reporting the largest snowfall ever recorded.
To be sure, these events do not prove or disprove human caused global warming. But the momentum is now very much on the side of skeptical scientists who question these theories and President Obama should at least pull back from his awkward juxtapositions.
Mooney is quite correct that weather isn't climate, but he shows he doesn't understand the relationship between climate change and extreme weather events.
Warmer oceans increase the amount of precipitable water available to both summer and winter storms. Because the vapor pressure of water goes up in a rapid non-linear way with temperature, modest increases in sea surface temperatures can cause major increases in energy available to storms.
Dr. Kerry Emannuel, MIT Atmospheric Sciences professor has shown a strong correlation between tropical Atlantic sea surface temperatures and Atlantic hurricane energy.
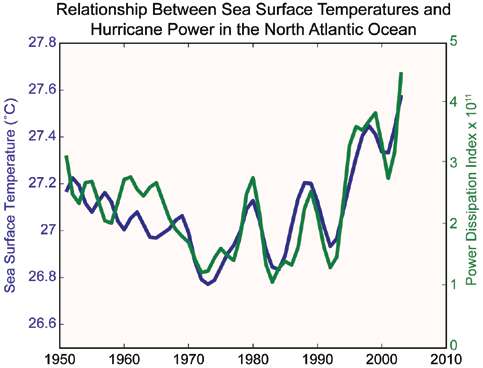
Heating of the oceans increases the amounts of water vapor available to both winter storms and tropical storms. More extreme precipitation events of all kinds are likely as the oceans warm.
Weather and Climate Extremes in a Changing Climate (PDF)
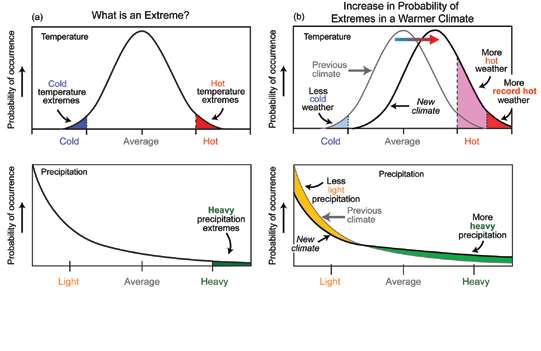
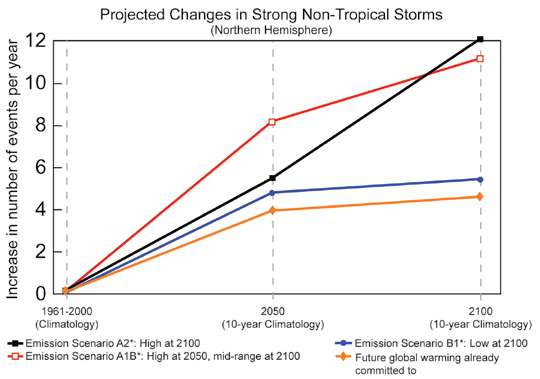
The report
Weather and Climate Extremes in a Changing Climate. Regions of Focus: North America, Hawaii, Caribbean, and U.S. Pacific Islands", A Report by the U.S. Climate Change Science Program and the Subcommittee on Global Change Research. [Thomas R. Karl, Gerald A. Meehl, Christopher D. Miller, Susan J. Hassol, Anne M. Waple, and William L. Murray (eds.)]. Department of Commerce, NOAA's National Climatic Data Center, Washington, D.C., USA, 164 pp.
predicts an increasing number of strong winter storms with increasing levels of greenhouse gases.
