As those who have read my state polling diaries since April know, I am a firm believer that state polling is a far better source of the true state of a campaign that national polling because they are far more of them, and there are more pollsters doing them. The data from state polling since the middle of this week is pretty clear: Obama's lead at this moment is growing.
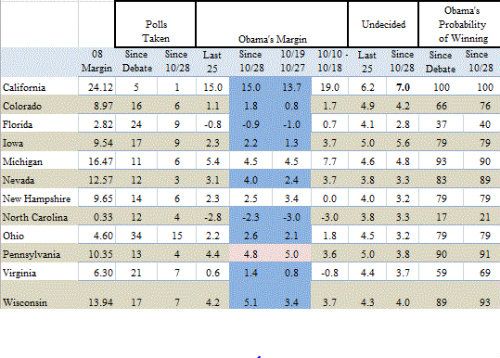
The table below is my chear sheet. Note in blue the movement since October 28. Obama's position in virtually every battleground state has improved:

You can also see this in the graph below, which includes a 5 day moving average of both national and state polling. It is important to note that the state polling shows an Obama lead of over 2 points - and the trend is clearly improving. In fact, state polling projects an Obama lead of 3.1% nationally.

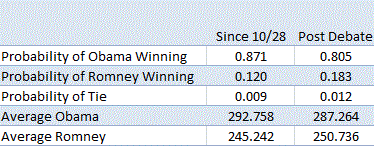
So what does this mean? Well, if you use the probabilities in the chart above (see my methodology below) you get the following:

You can run your own simulations here (though this is not as complicated as the model I have built) it is still pretty cool.
https://docs.google.com/...
In April of this year in the first of these diaries I wrote this:
The truth is at this moment Obama is in a strong position, stronger than most realize.
Romney needs something to change. The most likely thing to change is the economy
But the economy didn't tank, and while the race is a bit closer than it was in April, the fundemental dynamic has never changed. In fact I see pretty clear evidence that Obama's position is stronger now than it was a week ago or 10 days ago.
There are two more reasons to be optimistic:
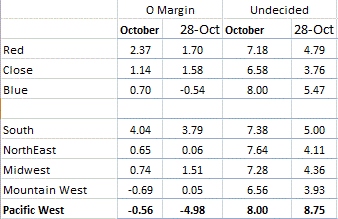
1. When you look at the undecided, they are highest in strong blue states like California. If those states follow their trend on 2000, 2004 and 2008, the undecided will break for Obama. It is worth remembering that in 2009 3 million of Obama's 10 million vote margin came from California alone. Note the undecided in the Pacific West in the table below. These are likely going to break Obama's way.

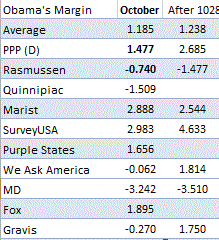
2. As I wrote earlier this year, it is worth noting that the young and the minorities are likely to have stopped cell phone service. It is worth noting in the list below that two of the pollsters that do call cell phones are also two of the pollsters that are finding the most Democatic Elections.

Methodology
In 2010 Chris Bowers did a detailed analysis of past election results.
Essentially, what that work found was the empirical odds of winning a race with a certain lead in the polling average. To summarize:
A candidate with a .5% lead wins 56% of the time
A candidate with a 1% lead wins 64% of the time
A candidate with a 2% lead wins 78% of the time
A candidate with a 3% lead wins 83% of the time
A candidate with a 4% lead wins 89% of the time
Go here for more detail:
http://www.openleft.com/....
I take these odds, and run 20,000 simulations. The odds presented are if the election was held tomorrow.


