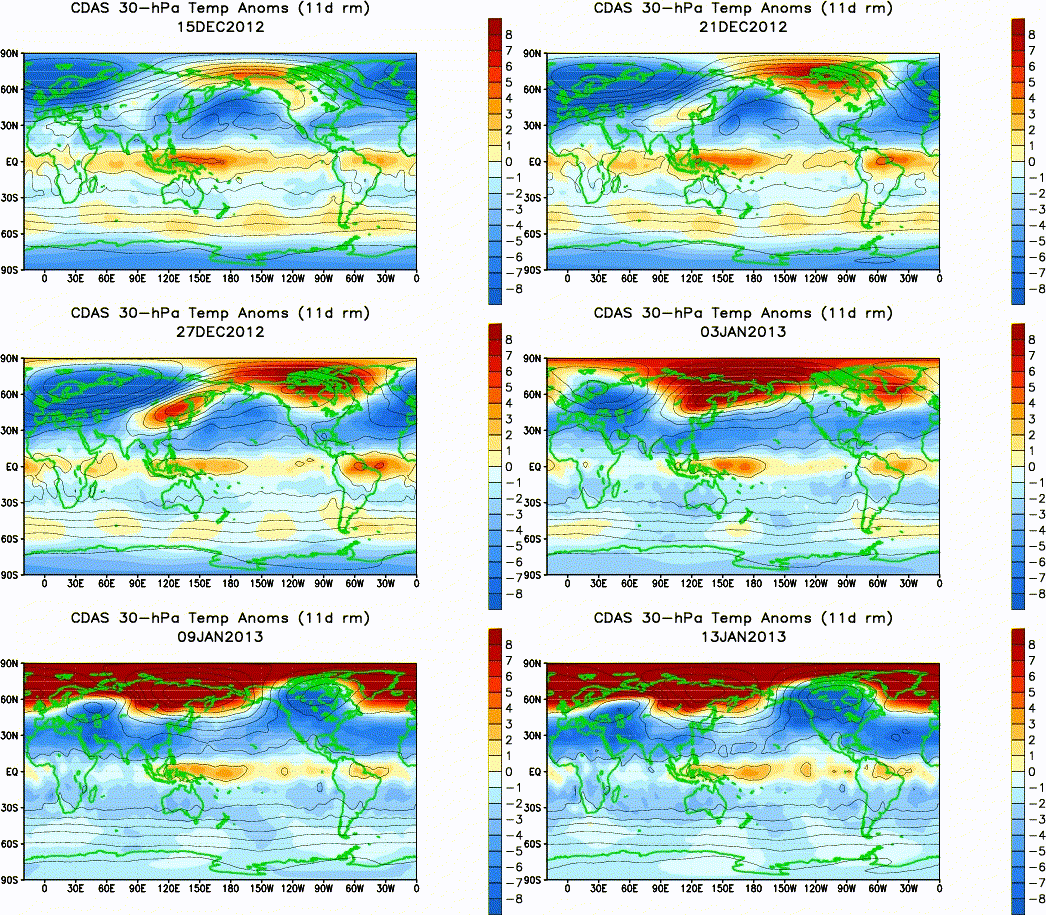
The polar vortex was persistently weak from November 2012 through March 2013. At the peak of winter, in mid-January, the polar vortex was split in two by a massive sudden stratospheric warming. Instead of a vortex, very high surface pressure built under a dome of sinking over the north pole. Astonishingly, high pressure over the pole extended from the surface to the mid-stratosphere from late November to mid-March.
The daily geopotential height anomalies at 17 pressure levels are shown for the previous 120 days as indicated, and they are normalized by standard deviation using 1979-2000 base period. The anomalies are calculated by subtracting 1979-2000 daily climatology, and then averaged over the polar cap poleward of 65°N.The blue (red) colors represent a strong (weak) polar vortex. The black solid lines show the zero anomalies.
High pressure over the pole pushed the weakened jet stream south over Siberia causing brutally cold weather in north-east Asia. Record smashing snow storms formed off the east coast of the U.S. when the blocked jet stream collided Arctic air with Gulf Stream moisture.
Paradoxically, this bizarre winter may be tied to the loss of Arctic sea ice. Even more paradoxically, the "Global warming Stopped in 1998" claim touted by climate skeptics may be linked to this winter's bizarre weather.
To claim global warming stopped in 1998 overlooks one simple physical reality - the land and atmosphere are just a small fraction of the Earth's climate (albeit the part we inhabit). The entire planet is accumulating heat due to an energy imbalance. The atmosphere is warming. Oceans are accumulating energy. Land absorbs energy and ice absorbs heat to melt. To get the full picture on global warming, you need to view the Earth's entire heat content.
The substantial build up of heat in the oceans since 1998 combined with an insubstantial increase in the temperature of the atmosphere has destabilized the atmosphere over the oceans. I think,
based on recent research results, that this destabilization has led to the rapid increase in sudden stratospheric warmings over the past 15 years. This January, convection in the tropical western Pacific ocean over the deep oceanic warm pool lifted an enormous bubble of warm air that rose up over Tibet, breaking through into the stratosphere, causing the sudden stratospheric warming. Previous year's sudden stratospheric warmings have also occurred when tropical convection was enhanced over the west Pacific warm pool.

Just this last week, high pressure built up over the Arctic in the second most extreme case on record. The Arctic Oscillation (AO) index dropped to a shockingly low value of -5.2. This very negative level is indicative of an extremely weak polar vortex.
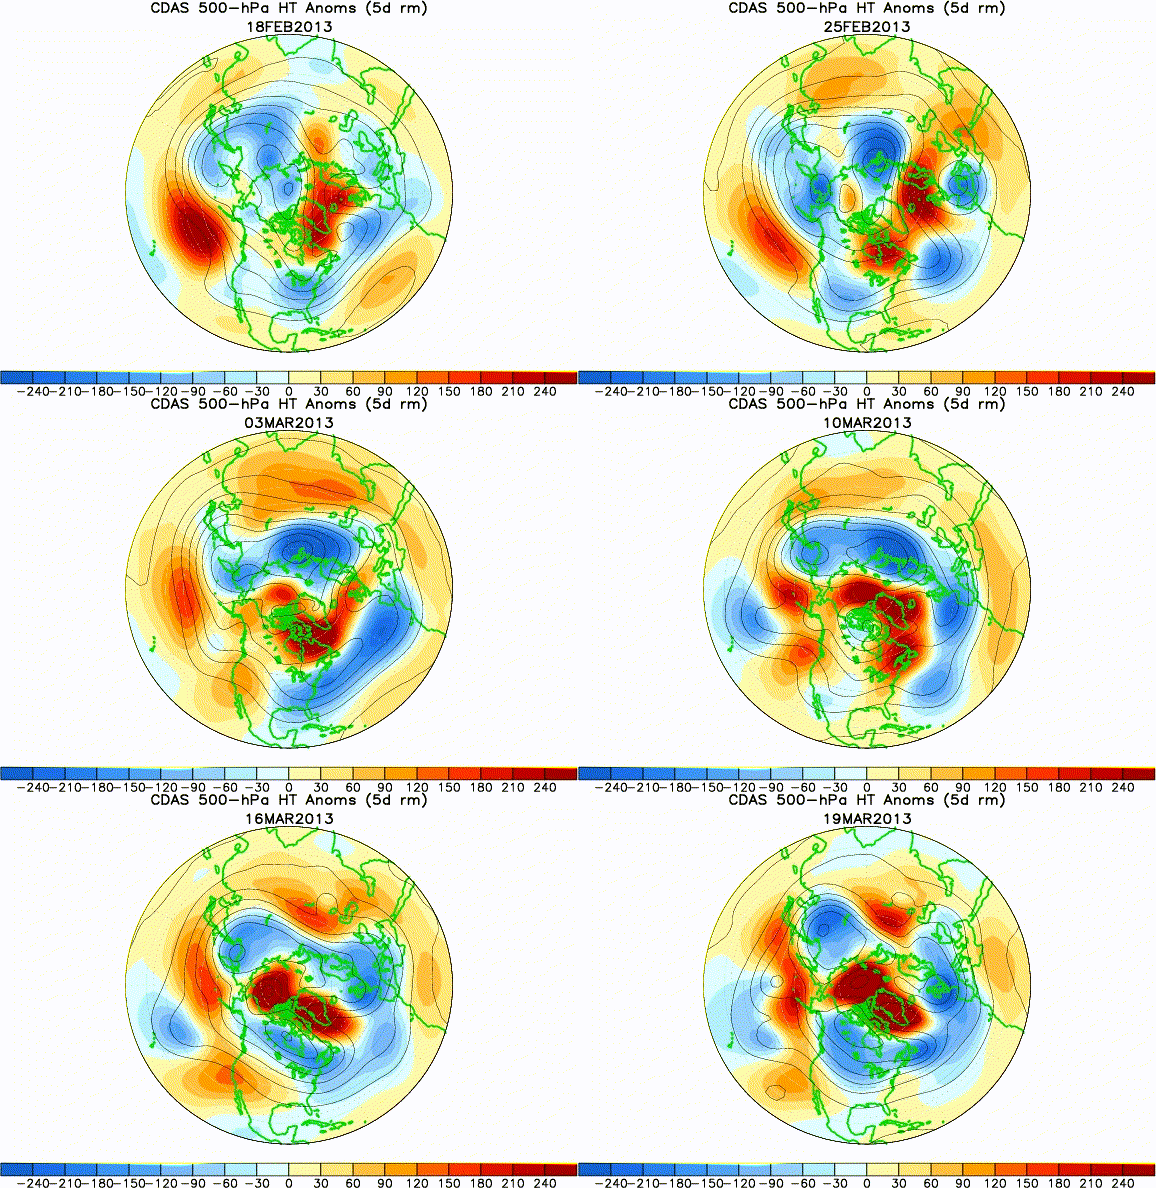
This animation of the 500mb surface - the height above the earth's surface where the air pressure is half the surface pressure - shows how blocked and contorted the jet stream has been this March. Observe how the large red bubbles of warm air have risen up over the abnormally warm waters around Greenland for the past 30 days. Greenland is one of the most likely areas on earth for "blocking" high pressure areas to form.

One measure of how contorted the jet stream has become is by measuring the difference in pressure between the Icelandic Low and the Azores High. There are two indices used to do this--one called the Arctic Oscillation (AO), which treats the flow over the entire Northern Hemisphere, and another called the North Atlantic Oscillation (NAO), which is more focused on the North Atlantic. The two are closely related about 90% of the time. When these indices are strongly negative, the pressure difference between the Icelandic Low and the Azores High is low. This results in a weaker jet stream, allowing it to take large, meandering loops, letting cold air to spill far to the south from the Arctic into the mid-latitudes. The AO index hit -5.2 today (March 20). This is the second most extreme March value of the index since record keeping began in 1948; only an AO value of -6.3 in March 1970 was more extreme.
Dr Jennifer Francis, professor of Atmospheric Science at Rutgers University, explained earlier this year how the loss of summer Arctic sea ice has led to the weakening of the polar vortex leading to more extreme weather. The weakened jet stream develops large north-south meanders, causing extreme weather events.
A just-published open access research report reconfirms the connections between Arctic sea ice loss and changes in winter weather patterns. It describes this winter's weather to a T.
Our observational analysis reveals that the change in the winter atmospheric circulation and frequency of cold events in mid-latitudes in response to winter sea ice loss is larger and more extensive than the response to autumn ice loss, even though the fractional change in ice loss is larger in autumn. Our results support the mechanism suggested by Cohen et al (2012) in which sea ice loss promotes additional surface evaporation, which results in earlier snowfall on high-latitude land (Ghatak et al 2010). The earlier snow cover insulates the soil and allows the surface to cool more rapidly, shifting the region of strongest poleward temperature gradient southward and consequently, a southward shift of the thermally induced wind flow. Positive pressure anomalies result further enhance negative temperature anomalies and the likelihood of cold spells and blocking highs, particularly over the mid-latitudes of North America and central Asia, along with anomalously cold winters in southern Europe and East Asia (Coumou and Rahmstorf 2012).


