Update 1 - I have added Connecticut and changed the maps for Louisiana, Michigan,
New Jersey, and the national maps.
Update 2 - I have improved the Illinois map with significant changes.
Update 3 - I have improved the 1VRA seat Alabama map and added one for Louisiana
and South Carolina.
In the wake of the 2012 House of Representatives election, we were left with a situation where Democrats won the House popular vote yet failed to regain the House. While it is a documented phenomenon that electing the House by single member districts disadvantages Democrats given our relatively higher geographic concentration, there is debate within the political science community as to whether or not gerrymandering was the determinant cause or whether single-member districts are to blame. Some have attempted to use statistics and regression to approach the problem, but to me this approach is fundamentally flawed because at the end of the day, the only alternative is to draw another map. In this diary I have done just that, using Dave's Redistricting App and relying on my extensive knowledge from years of reading Daily Kos Elections, conversations with redistricting experts, and research into communities of interest that might constitute a non-partisan drawn map.
My hypothesis is simple, yet proving and refuting it is not; if every state in the nation had drawn maps using the criteria of the California citizens' redistricting commission of solely VRA compliance, communities of interest, and local jurisdictional integrity without sacrificing the other two, then Democrats would have retaken the House in 2012.
In attempting to show that this is so, below the fold I'll present my alternative maps drawn with those criteria for the 34 states where gerrymandering, partisan or otherwise, had an appreciable impact upon the line drawing. First though, let's look at both the current House districts and the net impact of what nationwide California-style maps might look like. I am using California's independent commission as the model because it was widely praised by non-partisan interest groups as a model of fairness in taking the power to choose their voters out of the congress members' hands.
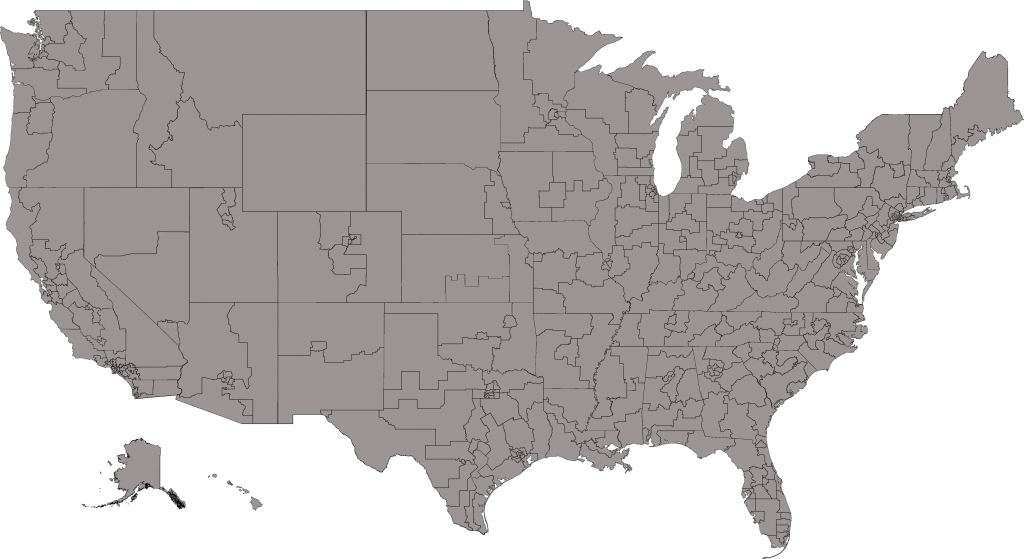
First off let's look at the actual districts with redistricting control highlighted:
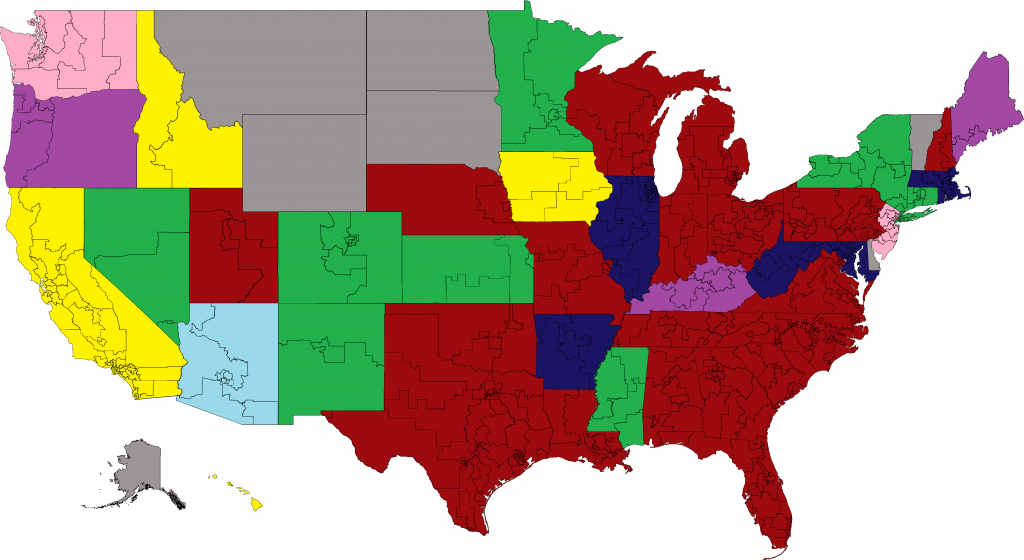
(Click through most maps for larger image)
Dark Blue/Red Controlled by Democrats/Republicans
Light Blue/Light Red Bipartisan Commission favoring one party over the other
Yellow Truly Nonpartisan/Independent Commission
Green Court Drawn
Purple Partisan Compromise
Gray At Large State
As should be immediately obvious, Republicans had a huge advantage over Democrats to the extent that they controlled the redistricting process, even in normally blue states such as Michigan, Pennslvania, and Wisconsin. Democrats also compounded the problem by not drawing maximally effective gerrymanders in several of the states we controlled such as but by no means limited to Arkansas. In total Republicans drew outright 217, just one shy of the majority of the House districts. When you include states where they were able to push their own compromise maps in New Jersey and Washington, that number goes up to 234. Democrats by contrast just drew 44 districts or roughly 1/5th as many as Republicans. When you include the compromise map that was largely Democratic drawn in Oregon, that number is still just a measly 49.
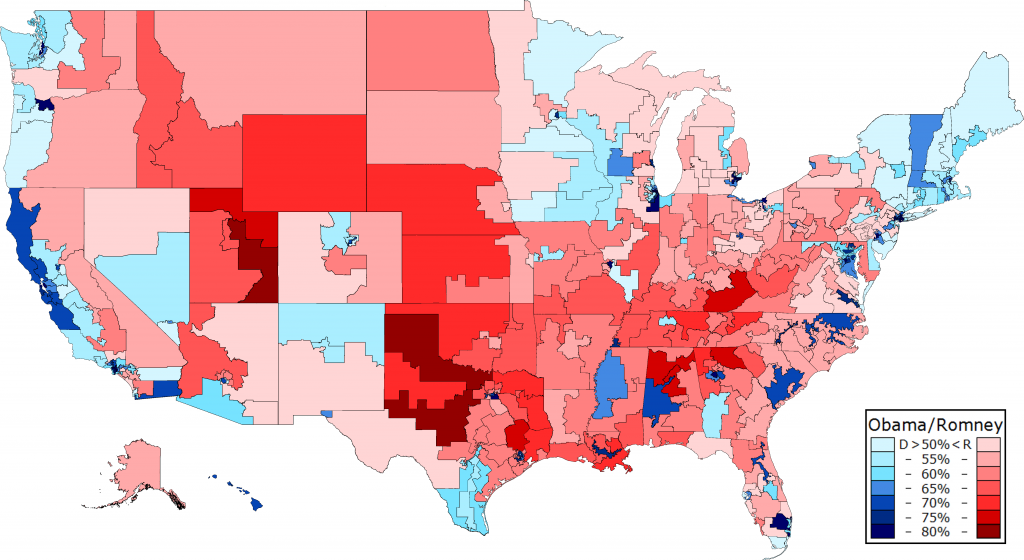
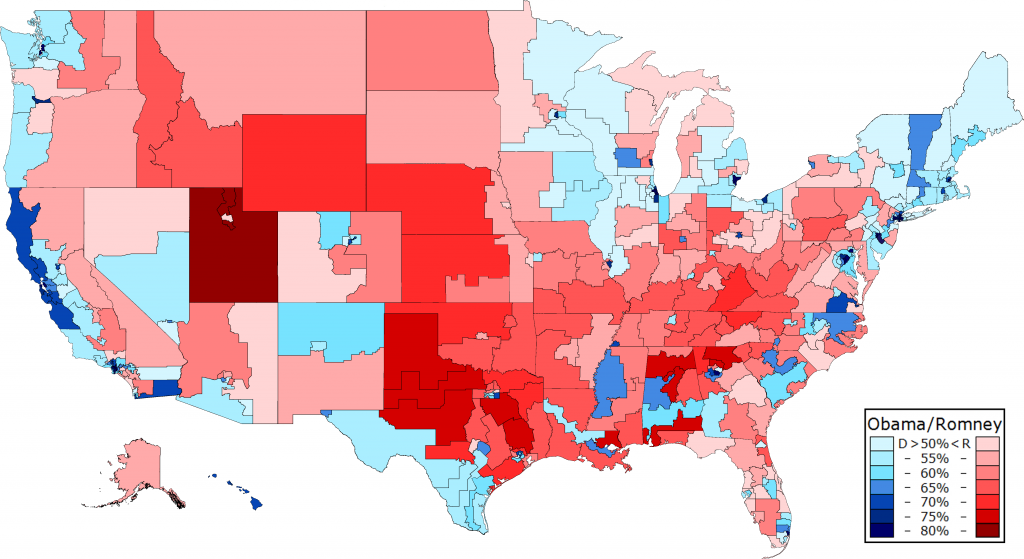
Next let's look at the presidential election by district:
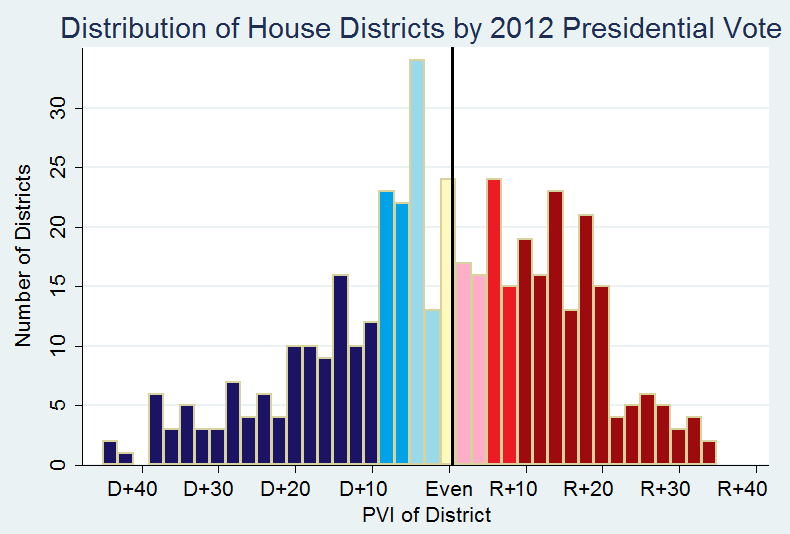
And that same data presented as a histogram:
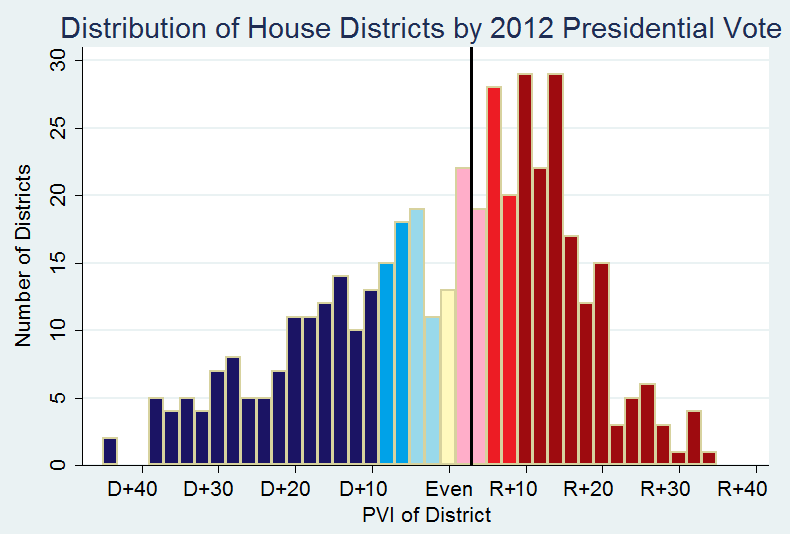
Giving you an idea of how hard it will be to retake the house as drawn, the median district is WA-03 at R+2.8 meaning that Mitt Romney won it by 1.6% despite losing by 4% nationally. The overall skewness was approximately .470 to the right with many districts being clustered in the relatively safe R+6 to R+15 range while Democrats are packed into much fewer but bluer districts. Overall, there were 209 Obama districts and 226 Romney districts while just 195 were D+ and a whopping 240 were R+.
Nationally, Democrats won the House popular vote by 50.6% to 49.4% overall (two party only), however this is with many more districts being uncontested by Democrats than Republicans. If we extrapolate out for the uncontested seats the percentage of votes won by congressional candidates compared to the presidential election by district, we come to a popular vote of Dem 51.2% to Republicans 48.8% which I believe and others have shown statically that this should be sufficient for Democrats to retake the house, IF the lines weren't so biased.
Subsequently, Democrats only won 201 seats or just 46.4% overall with just 9 Romney district Dems and 15 Obama district Republicans:
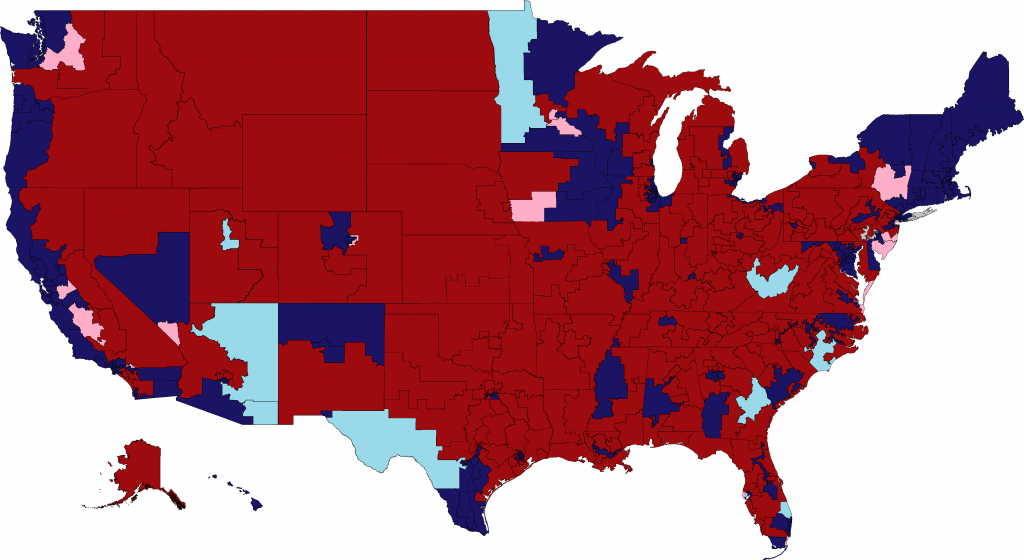
Light blue is Romney-Dem while pink is Obama-Republican
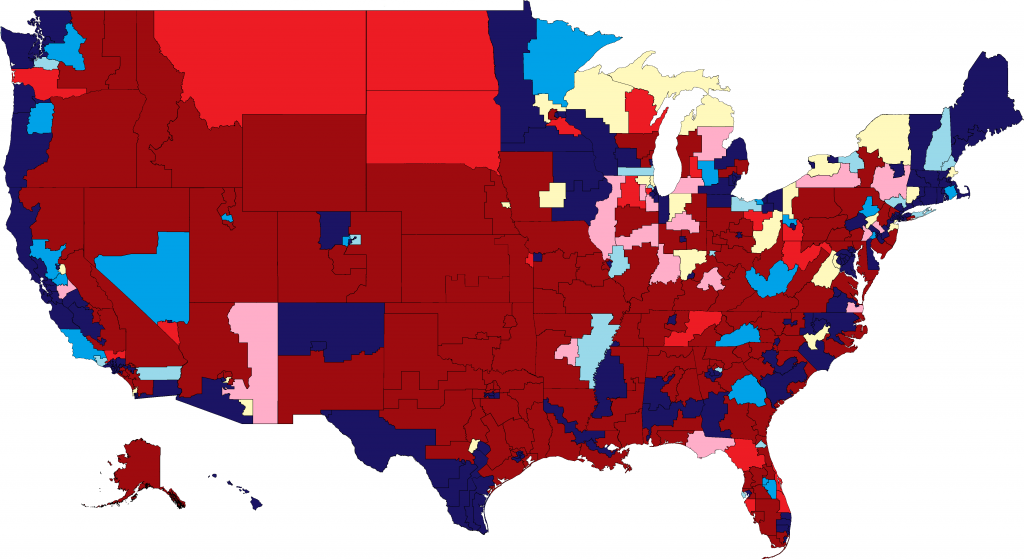
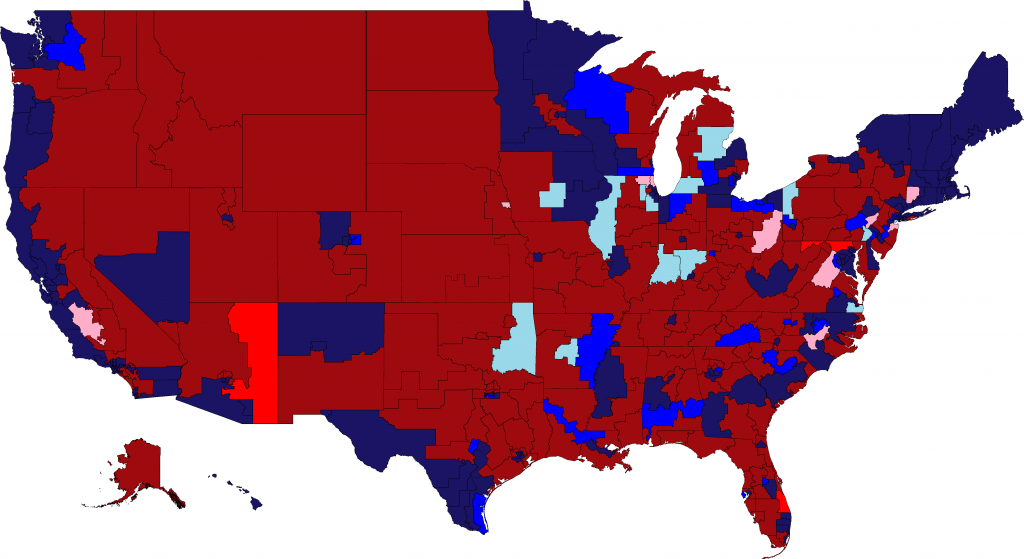
So what might the districts look like if they were redrawn nationally by an independent commission similar to that in California? Below is my best attempt for the 34 relevant states (with the detail below the fold):
And colored by their estimated 2012 presidential results:
And presented as a histogram:
As you can see, the districts are much more evenly distributed though there is still a milder GOP skewness of .356. Overall the median district is now AZ-02 (and represented by a Democrat) at R+0.6 and went for Obama by 2.7%, a difference of a 4.3% margin. Now there are a total 237 Obama districts to just 198 that went for Romney, which is much more reflective of Obama's 4% national win. However there are still a majority of R+ districts but it is much reduced to just 223 compared to 212 D+ ones.
So how might the House of Representatives elections played out under the preceding map? Here are my (imperfect) race ratings for the districts which rely mainly on the underlying electoral data but also makes a few assumptions about candidate quality I'll explain later:
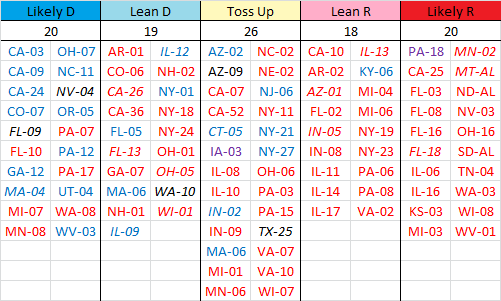
All remaining districts are safe and total 177D-154R for a total of 216 at least Lean D and 193 at least Lean R.
Given these ratings and how I feel making calls, the range I'll project for the difference between the actual election and how it might have happened under these lines is as follows:
Districts in vivid blue or red are those that I feel strongly confident would have changed hands, while those in light blue and pink are those where it's plausible the outcome might have changed but if forced to chose don't think would have flipped or not flipped, with light blue being possible yet not probable Dem wins and pink being vice-versa.
Overall, I believe that Democrats would have won 224-234 seats under lines resembling these, not only winning us a majority but a working one at that, yielding us a generic ballot in the D+2-3 range consistent with the accurate pollsters who nailed the presidential election. The net gain stands at 23-33 from the 201 that we currently hold.
So with the lines this stacked against us, what can we do about it? As I've written about previously and in much greater detail, we should be doing everything within our power to pursue independent redistricting commission constitutional amendment initiatives in Michigan, Ohio, Florida, Nebraska, and Arkansas (in that order) which could have yielded us an additional 10-12 seats last year which is more than halfway to 17.
If you want to check any of my data, here is the spreadsheet with all 435 districts and here is the folder containing them by individual state with more detailed data as well as the individual DRA files. All of this was collected either from the relevant state board of elections equivalent or Daily Kos Elections itself. So now follow me over the fold to look at the maps and data in depth. If you have a well-reasoned critique of one of my maps and a detailed justification for why something should be changed, then I welcome your viewpoint. Keep in mind that I can't be an expert on cultural geography in every state and that I have tried my best to approximate Communities of Interest (CoI) the way the California map does.
Alabama
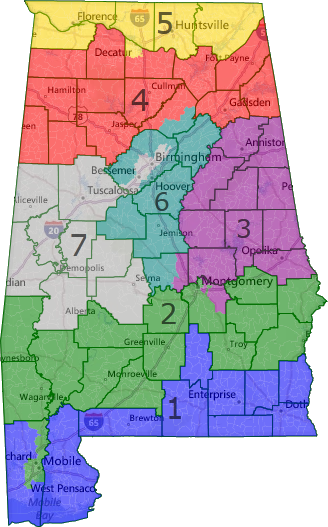
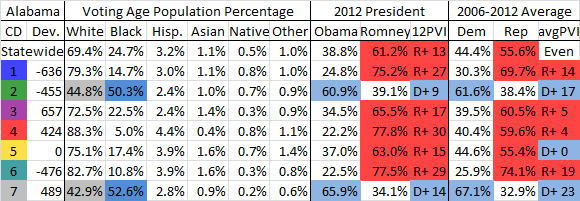
Alabama has a Republican gerrymander that sought to shore up the recently recaptured 2nd against Bobby Bright. This state though, more than the vast majority of states is where the VRA ought to be enforced to the hilt and it is my belief that the state, being a quarter black, should have two VRA mandated black majority districts. It is ridiculously easy to draw a 2nd one; I only split 6 counties in the entire map and nothing double crosses. The only 'ugly' thing about it is that it uses water contiguity but this could be alleviated with precinct splitting. Some might complain that we can't force a Mobile to Montgomery district, but then why are the current iterations of SC-06 and VA-03 required when they unnecessarily travels from Charleston to Columbus and Hampton Roads to Richmond, respecitvely? Under this map, any generic Democrat wins in a cakewalk in the 2nd district.
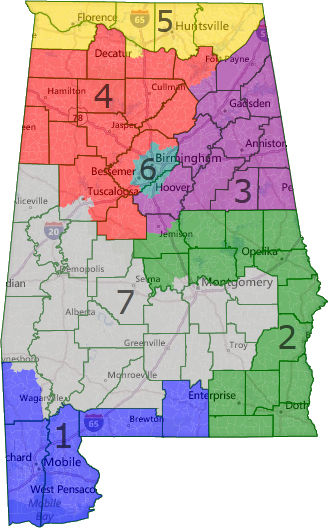
However, if we're going to disagree that a 2nd VRA district is required, that still leaves us with a 2nd solidly Democratic district. As you can see, it was quite easy to create one VRA black majority district that is confined entirely to the Black Belt region of Alabama and is anchored by Montgomery. The district only splits 3 counties and would be safe for an additional Democrat as an open seat in 2012. This allows me to take Birmingham and nearly every single one of its suburbs and place them in the same district. Obama won it by almost exactly his national margin and it would have been perfectly safe for incumbent Teri Sewell in presidential years, but she would have to work for it in a midterm. You could alternatively draw it so that the 6th takes in all of Jefferson county and a tiny bit of Shelby, but since it had to have some of the latter anyway I figured I'd try to drop all of the rural areas and take in as many suburbs as possible. None of the other districts is really competitive, with the least red being the 5th which is about the same partisanship as the state. Current 6th district incumbent Spencer Bachus would have no district he could win.
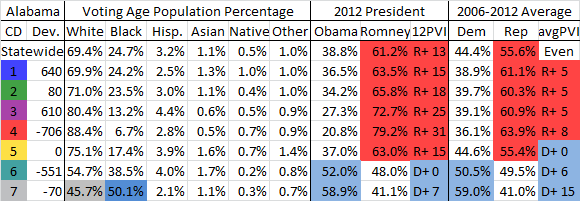
Arizona
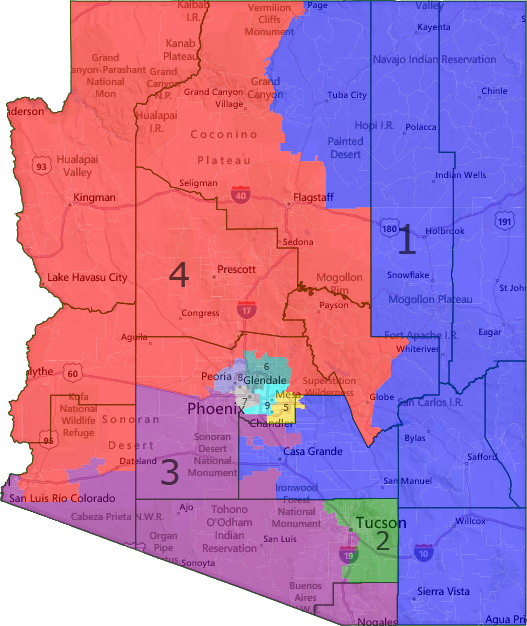
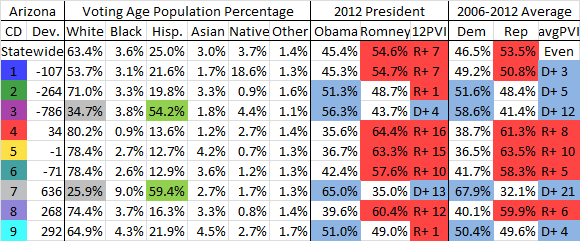
Arizona had an independent redistricting commission pass its map and while I certainly love the idea of gauging partisan competitiveness when drawing the lines as it eliminates the structural GOP bias from single member districts, this is not the same criteria as used in California and is certainly not non-partisan. Given that this is conservative Arizona, considering competitiveness led to a mildly Dem friendly map. Arizona was the only state where Dems won a minority of the vote and a majority of the seats.
The big difference here is the 1st district which gains the rest of Pinal County, all of Cochise, and drops Flagstaff to become several points more conservative. Kirkpatrick would have come close, but still lost to Jonathan Paton. Ironically it's as conservative as the old one she won in 2008 and narrowly lost in 2010. The other differences are that the 2nd, by dropping Cochise County, gets a small amount more favorable to Dems and would have seen Ron Barber win somewhat more comfortably though still close against Martha McSally. Then, there is the 9th district which is the real question mark on the map. There are many ways to draw it, but this one tries to preserve the CoI of the neighboring 5th and 6th as much as possible which means the district is largely Tempe, south Scottsdale, minimal parts of Phoenix, and the more Hispanic and middle/lower-class parts of western Mesa/Chandler. Obama still narrowly won here and as Kyrsten Sinema only barely ran behind him in the two party vote share, she'd have likely narrowly won here too over Vernon Parker with the Libertarian again playing spoiler. The 3rd district is somewhat less liberal but still pretty safe and no other district's partisanship has significant change.
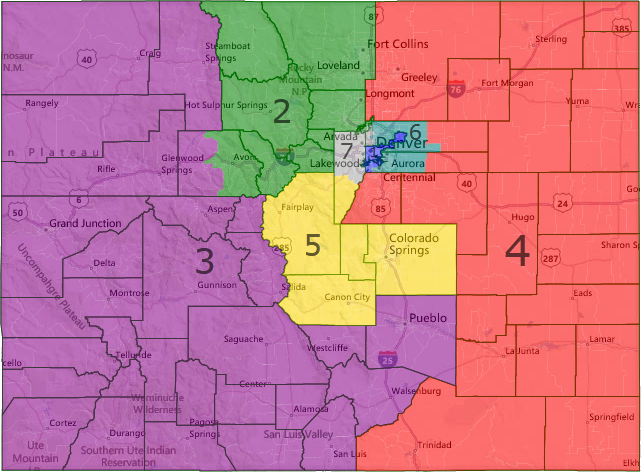
Arkansas
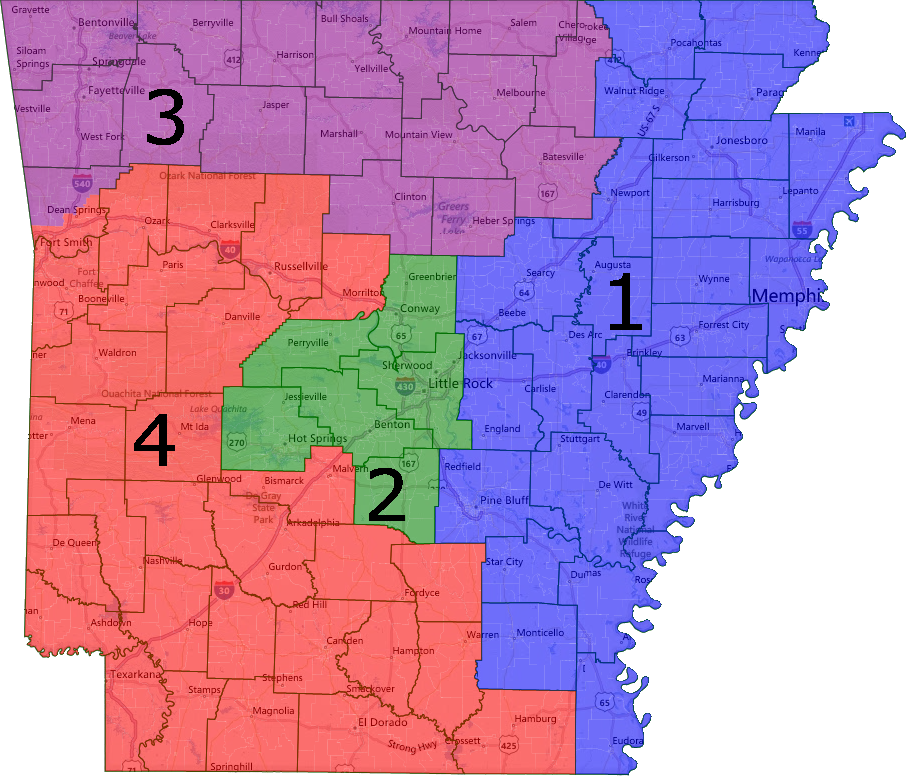
Arkansas was a state where, despite Democrats controlling redistricting, saw Republicans sweep the 4 seats thanks to a dummymander that tried to make 3 of them winnable rather than 2. As such, no seat is optimized for Democrats, but that changes here. By adding Pine Bluff and the rest of the Delta region, the 1st district is now a whole 8% more Democratic than the state at large and most likely would have drawn a much more formidable Democrat such as 2010 nominee Chad Causey, rather than small time and woefully underfunded prosecutor Scott Ellington. Despite having massive spending advantages, the Republican candidates only won 55% here and against a well-funded Blue Dog as Causey would have been, I think that we could have won this seat. Even Blanche Lincoln won 48.4% here in 2010 and no other Democrat besides her was held below 56% even though Republicans won three statewide offices that year. So I feel pretty good about us winning it, especially since it has the parts of Arkansas where local Democrats usually run far ahead of the president.
The other district that remains in play is still the 2nd which is trending Dem relative to the state (which itself is trending GOP). We nominated a total 3rd tier candidate in liberal lawyer and former state Rep. Herb Rule who ran behind Obama, most likely due to undervoting. Had we nominated a serious candidate, it's certainly within reason that we could have won here with the Libertarian who took 4% playing spoiler. Obama won nearly 44% here and it isn't unreasonable to see a Blue Dog running just a mere 4% ahead. Again, it would all come down to counter-factual candidate recruitment so I didn't include this one in my tally, but it would certainly be competitive if we fielded a serious candidate. The flip side of all this is that the 4th becomes more Republican but seeing as how we lost it massively and I doubt Mike Ross wouldn't have retired as he wanted to run for governor next year, it doesn't matter.
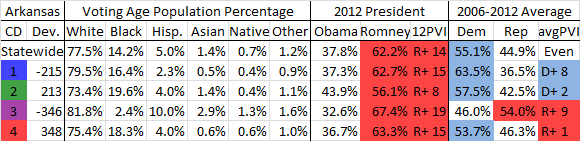
Colorado
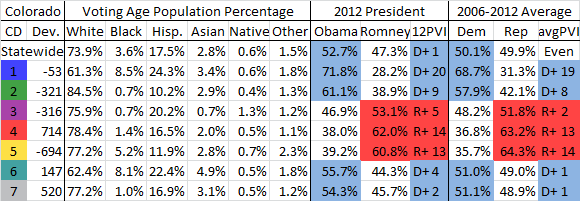
Colorado's map was court-drawn but wasn't entirely non-partisan. The state level (IIRC) court asked for submissions from the two parties and the Democrats' proposal won out, ironically to our detriment. Their proposal was crafted so that state Senate President Brandon Shaffer could run for congress and among other things I don't think were particularly logical for a CoI map, put the Ken Caryl area with the Denver district rather than the Jefferson County suburban 7th. I've corrected for this and it subsequently forced the 1st and then 6th to rotate counter-clockwise which puts the nail in the coffin for Mike Coffman. The district gets 2.5% more favorable to Democrats and seeing how he only won by 2%, he's toast. It's also possible that someone like Andrew Romanoff, who is running against Coffman this cycle, might have run with the enticement of a House majority or better recruiting in a more optimistic environment, but that is essentially unknowable. Finally, while the 1st through 5th remain the same in partisanship, the 7th gets knocked down to being just modestly Dem leaning, but Ed Perlmutter is an entrenched incumbent and wouldn't have had much trouble last year.
Connecticut
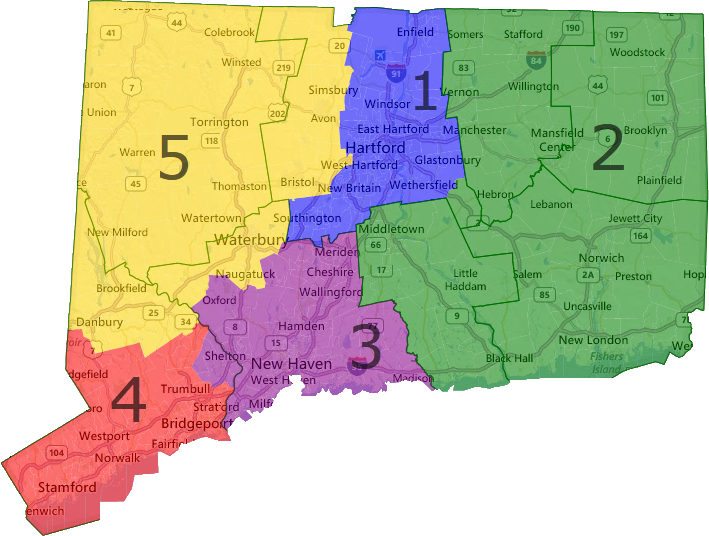
This map was drawn by DKEr ProudNewEnglander, a Connecticut native, and it undoes what was essentially a holdover from the compromise map from 2002 when the state lost a district in reapportionment even though the current map was court-drawn. The big change is that the 5th district becomes slightly worse for Dems to the point where it becomes a tossup, but seeing as it's still slightly D+ and only gets a point worse on average, I think Esty would narrowly prevail.
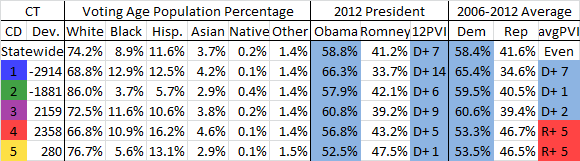
Florida
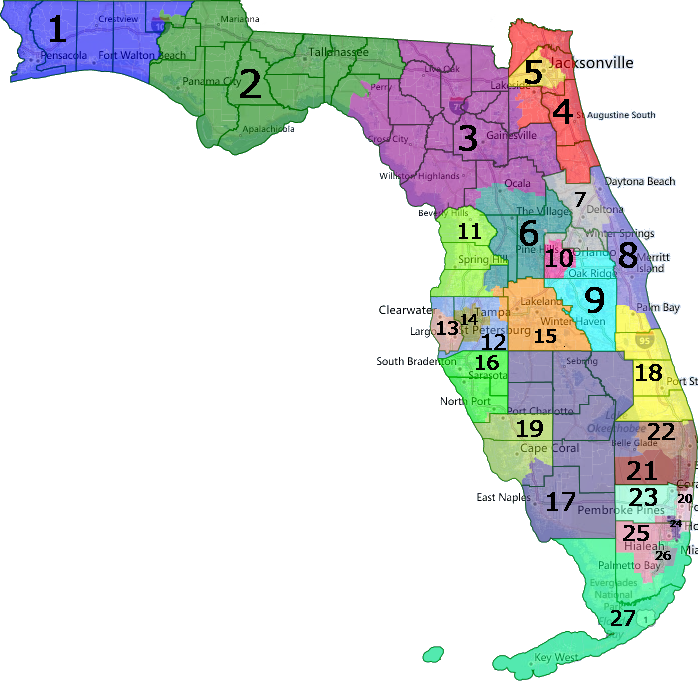
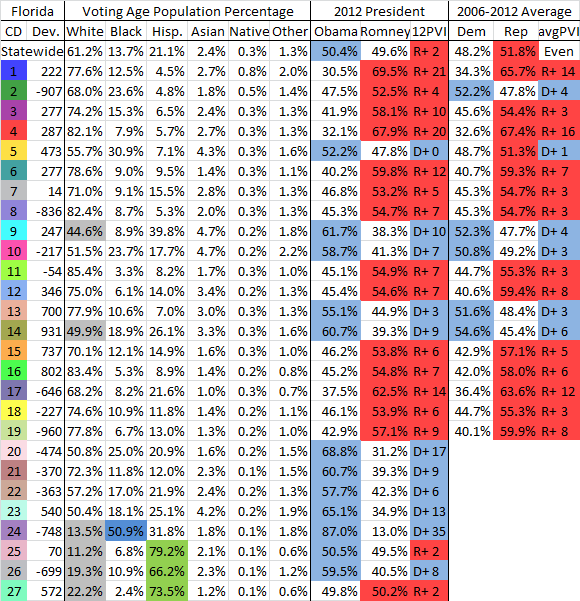
Florida saw yet another Republican gerrymander, but with the power of the ballot initiative could potentially see a map like this enacted. I will admit that I wasn't exactly sure what the hell to do with some of the huge counties like Miami Dade that also had VRA concerns, but I generally tried to make all three Hispanic VRA seats relatively equally as Hispanic so as not to pack them.
Anyway, what would be guaranteed to happen is that the 13th district gets much more Democratic thanks to absorbing St. Petersburg. Bill Young has been dragged kicking and screaming from not retiring in recent cycles and in the face of a legitimate blue seat at age 82 I think he'd do just that in which case this becomes an easy pick up. Even if he doesn't though, the district gets 4.5% more Democratic which cuts off 9% of Young's 15% margin and that was against a very underfunded candidate so it's very possible he may have just flat out lost, albeit narrowly. The other guaranteed pick up is the 10th where Dan Webster, who nearly lost an R+6/7 district, gets a D+7 one and is toast against former Orlando Police Chief Val Demings. Joe Garcia, who destroyed scandal plagued Rep. David Rivera in a swing district gets a safe one in South Florida.
Unfortunately though, the 5th district becomes only mildly Dem leaning, but given that this is the Deep South and Republicans hold not even zero D+ districts there, but zero Obama districts there, we'd hold this seat with someone in the Sanford Bishop mold like Jacksonville mayor Alvin Brown but possibly not incumbent Corrine Brown. Furthermore, and this might have just been my ignorance in drawing the lines, but given how close his narrow victory over Allen West was and the fact that Rooney would probably run in the 18th, Patrick Murphy is out of luck and almost certainly wouldn't have won, even over West disturbingly. This area of the state is trending Republican though and Murphy will likely run statewide at some point, so I wouldn't mind trading this district for two solid liberal ones in Orlando and Pinellas County. Finally, the 2nd district, which was eminently winnable with the right candidate, gets very slightly more favorable to Dems.
Georgia
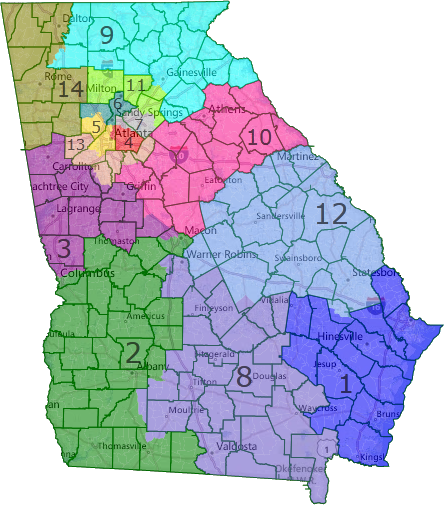
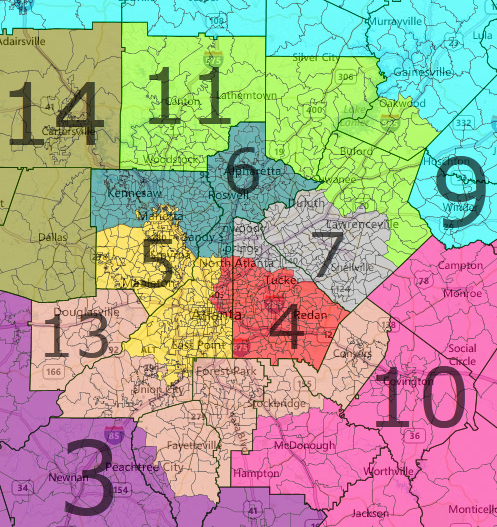
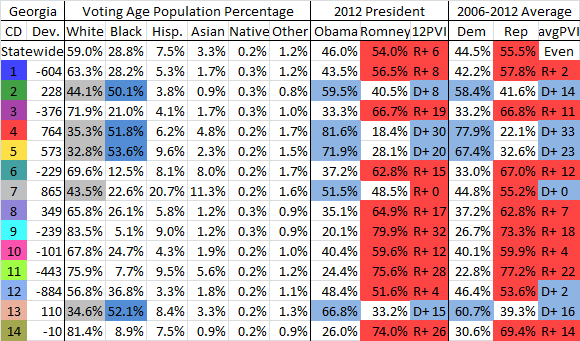
Moving on is Georgia which Republicans also gerrymandered. Here it's all upside as John Barrow gets a district he'd have easily held onto last year and where we would potentially be able to hold it if he ever runs statewide. Rob Woodall gets an Obama district with just northern DeKalb and most of Gwinnett County and he would have almost certainly lost as a hard righter in an Obama district in the South. Sanford Bishop' district should have been made to be majority Black to comply with the VRA and I have done that here, bumping it up about 1%. No other district becomes competitive though, but since Barrow was originally supposed to be an underdog and his actual seat is gone if he ever vacates it, this is essentially a +2.
Illinois
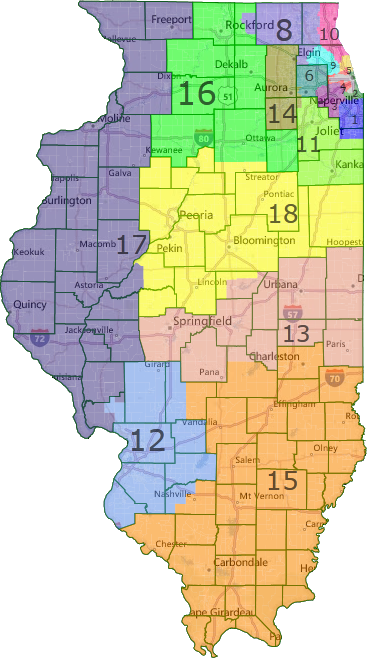
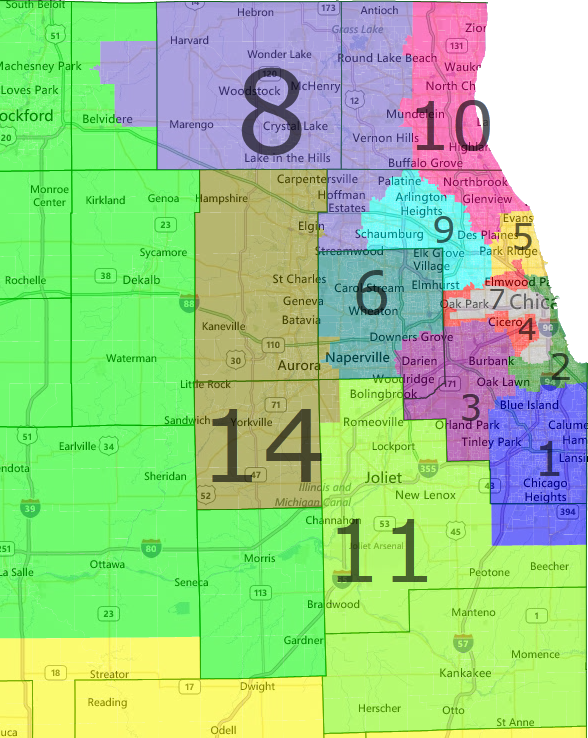
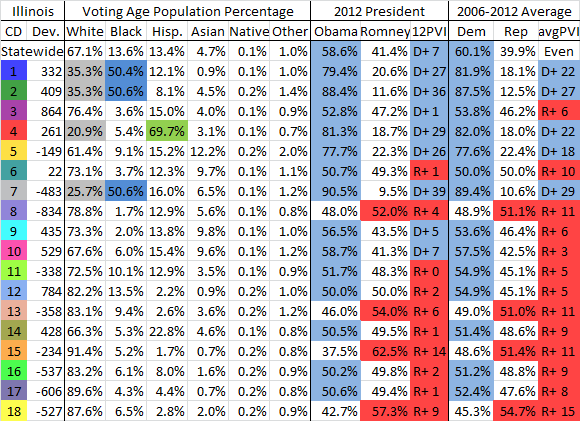
Being one of the few states that Democrats aggressively gerrymandered, Illinois is one where we actually see some major downside. This map was largely influenced by one drawn by user GaleForceBurg Right off the bat, Cheri Bustos likely loses the 17th in a close match as does Bill Foster in a rematch against 14th district incumbent Randy Hultgren. Both the 8th and 10th become tossups, with Tammy Duckworth running in the neighboring Lean D 9th while Jan Schakowsky and Mike Quigley duke it out in the much safer 5th. The 10th would have been one of the closest races in the country last year as it gets slightly more Republican on average, but slightly better for Obama making it quite hard to make a conclusive decision. Still I think Schneider would have eked it out, but we're definitely talking recount territory here. In the adjacent 8th, Joe Walsh actually gets a Republican leaning district, but he likely faces a much more moderate Democrat than Tammy Duckworth, who barely ran any sort of negative campaign against him. Given Walsh's extremism and personal issues such as being delinquent on over $100,000 in child support, I think our candidate could run the requisite 2% ahead of Obama to beat him as he really was a fluke in 2010. Lastly, we have the downstate districts where Bill Enyart sees a slightly narrow but still fairly comfortable win in the 12th, while David Gill loses by a slightly larger margin in the still competitive 13th. The most amazing thing to me about this map is just how many districts are competitive with a full 10 out of the 18 being swingable under the right conditions.
Indiana
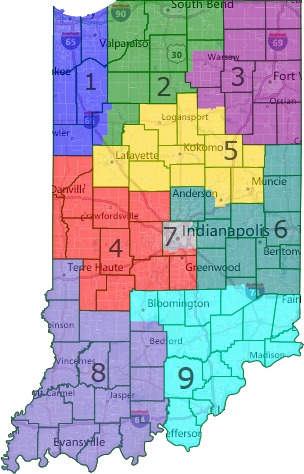
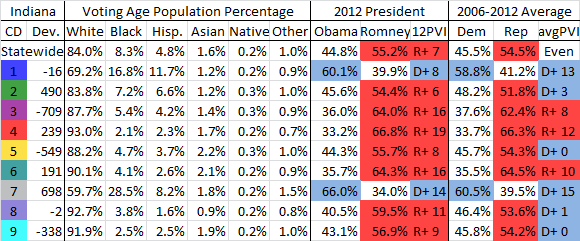
Indiana saw yet another Republican gerrymander, but unlike previous states it was fairly mild in that it could have targeted the 7th and made the 2nd much more Republican by trading South Bend to the 1st, but in the end it was fairly effective in producing the intended result of 7-2. This map makes the 2nd more of a swing district and given how poorly wacky Jackie Walorski did against Brendan Mullen despite a moderate spending advantage, there's little chance she'd have won this 2% more Dem district when she only won by 2%. There's also the possibility that Joe Donnelly wouldn't have run for senate in which case his incumbency makes this an easier hold. Additionally, the 9th becomes much more competitive locally as southern Indiana is an area where Obama underperforms local Dems in a big way. I'm assuming that Shelli Yoder would have gotten more outside funding here and made a race of it, or that we might have gotten a more seasoned candidate (a Baron Hill rematch perhaps?) and though we more likely that not would have still lost it, it's certainly within reason to think we might have won. Additionally, the 8th is more or less the same partisan wise and Dave Crooks turned out to be a bit of a dud against the underwhelming Larry Buschon so the only way we'd have won that is if the chance at a majority enticed Brad Ellsworth into running again, which is of course unknowable. Finally, the 5th becomes an Obama '08 district but is still fairly Republican at about the same partisanship of the state. Had Dan Burton not retired he might have lost, but Susan Brooks or David McIntosh would have won here just not with 60%.
Iowa
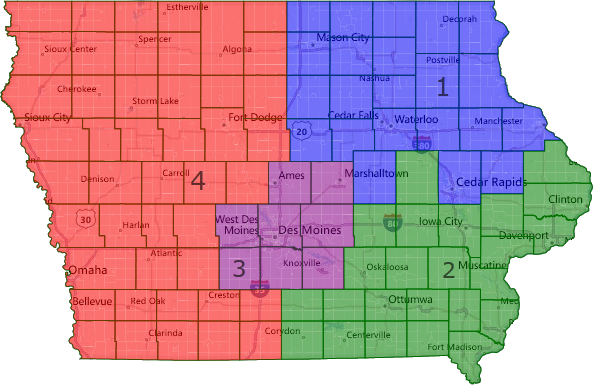
Iowa is an odd state to include because it already has a very effectively non-partisan commission drawing the lines. However I felt that it was worth drawing a different map for precisely one reason: the Iowa constitution does not allow for county splits and encourages the lowest population deviation. Indeed, under the actual map no district is more than 100 people off of the ideal. That led to the state being sliced rather like a square pizza and splitting the greater Des Moines area. Here I've rectified that while still preserving county integrity and keeping the deviation within 1%, something that the courts similarly allowed in West Virginia which also doesn't split counties. Subsequently, while the 1st and 2nd are relatively unchanged, the 3rd gets a good deal more Democratic. Unfortunately though, Tom Latham is a very strong incumbent while Leonard Boswell had pathetic fundraising and he would have still lost here, but it would have been a hell of a lot narrower than 9% and if Latham had run statewide as he is rumored to, this would have been a much easier pick up. The flip side is that Steve King gets a much safer perch and probably wouldn't ever run statewide, but with his hesitation to do so this cycle that wouldn't really matter.
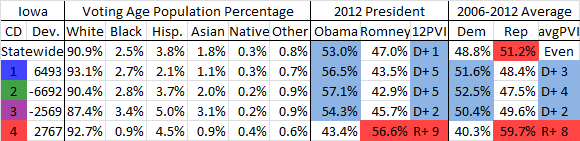
Kentucky
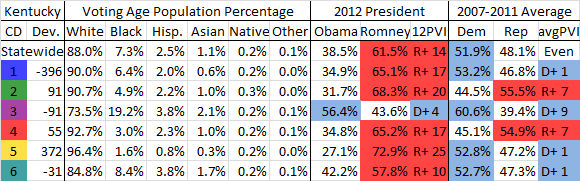
Kentucky is a state which has divided government and rather than have a court draw the lines like this, had the legislature compromise on an incumbent "protection" plan that backfired when Ben Chandler, who voted for cap and trade, lost big among normally conservadem heavy coal counties. This map undoes the incumbent protection which, while the Obama numbers are a very poor indicator, makes the 1st and 5th several points more Democratic while the 6th gets slightly more Republican. Still, the coal heavy east and west of the state are trending sharply Republican while the middle is trending Democratic so the partisan outcome is relatively minimal. While Chandler's 6th district relies less on coal Dems for its Dem strength, he still would have lost as he ran a poor campaign, but his cap and trade vote was the nail in the coffin of his political career.
Louisiana
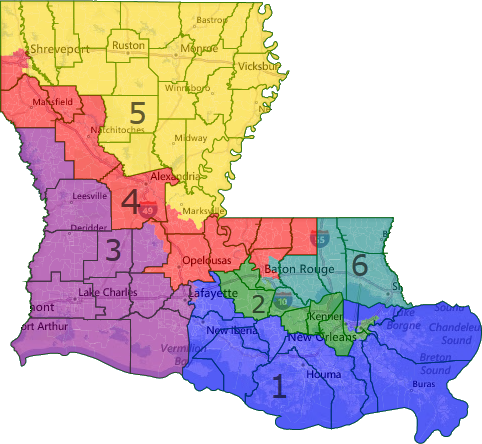
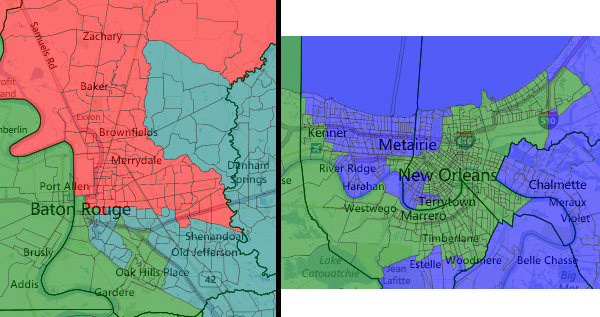
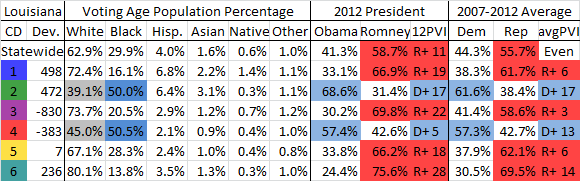
Louisiana, more than almost any state besides Mississippi is one of the most racially polarized in the nation and as such I think it is ridiculous that it is not required to draw a second VRA majority black district when it clearly is the case that the white majority votes as a block to deny the black minority the ability to elect the candidate of its choice. The state is also nearly a 3rd black, yet it only has 1/6 districts being black majority. Here I've changed that while trying to keep the map as clean as possible with minimal parish (county) splits and no water contiguity across the opposite shores of lake Pontchartrain. The 2nd district is still majority black while the new 4th district stretches from Baton Rouge to Shreveport and is majority black as well while splitting all of four parishes. This district is similar on the face of it to the 1992 version that was struck down by lower level courts, but that one took a hacksaw to cities and Parishes while this one does not.
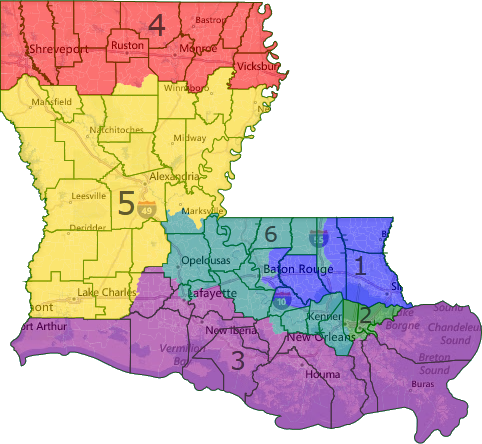
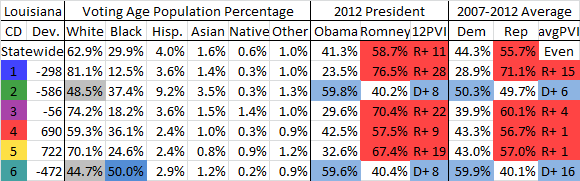
However, like with Alabama even if you're not sold on mandating the second VRA district, it's quite difficult to get a map that doesn't result in two Democrats. Starting with the premise that drawing a Baton Rouge to Shreveport district can't be forced, we go back to the drawing board. If you try to maintain the New Orleans based 2nd district as the VRA seat, you're required to shred apart both the greater Baton Rouge and New Orleans areas and that is purely unnecessary. The old 2nd district was contained entirely within the New Orleans area and it just so happens that you can fit almost the entirety of the metro area in one compact district. That allows the Baton Rouge based 6th to become a fairly compact VRA district without even setting foot in New Orleans. A bonus is that racial polarization is much higher here anyway compared to the New Orleans area. As such, you get two still safe Democratic districts, but the New Orleans one now might elect a white liberal like Mitch Landrieu, the current very popular mayor. From a purely electoral standpoint, this map is actually better than the 2VRA one because the 4th district in the north of the state is now theoretically winnable whereas before none of the others were. Finally, instead of giving then Rep. Landry the short end of the stick like the actual map did, his seat is revived as the Acadiana based 3rd and 4th district Rep. John Fleming keeps his seat. In exchange, Charles Boustany is thrown in at a disadvantage with 5th district Rep. Rodney Alexander while Reps Steve Scalise and Bill Cassidy would both run in the 1st unless Cassidy retired early for his 2014 senate run.
Maryland
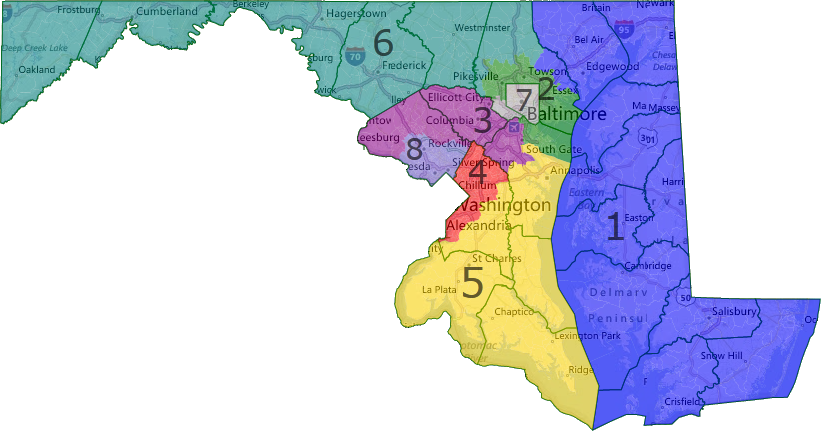
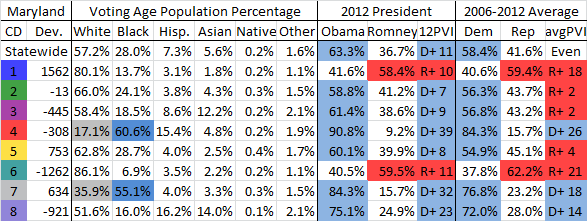
Showing you just how few opportunities saw Democrats take advantage of gerrymandering, Maryland is just the only other state we drew where non-partisan maps lose us seats. Democrats in the state easily could have drawn an 8-0 map but the demands of John Sarbanes and Dutch Ruppersberger scuttled that and forced us to only draw 7-1. As such, we lose just one district, the 6th when a non-partisan map is implemented. Though it is possible to draw iterations where the 2nd or 5th become nominally swingy, these are done in VRA non-compliant ways that pack the neighboring VRA black majority 4th and 7th too much. About the only ugly thing here is that the 2nd uses water contiguity, but that is unavoidable without splitting Baltimore proper illegally or packing the 7th. As such, this map would be a very solid 6-2, just like last decade's.
Massachusetts
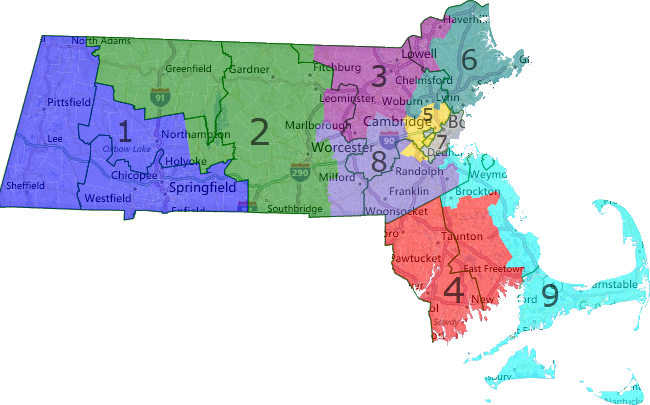
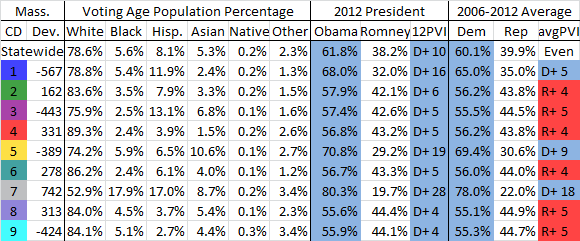
Massachusetts is another state Democrats drew but there was relatively little gerrymandering done to protect our vulnerable seats and indeed, this map even makes the most vulnerable one John Tierney's 6th, a point more Democratic. The biggest losers are the 2nd, 4th, 8th, and 9th districts but every single one on the map is still pretty solidly Democratic thanks to incumbency, strong candidates like Joe Kennedy III, and their partisanship. I tried to minimize town splits as counties are not really relevant in New England. This map, like the real one, still results in 9-0 and if anything is slightly better since Tierney, who only won by a point last year, gets a better seat.
Michigan
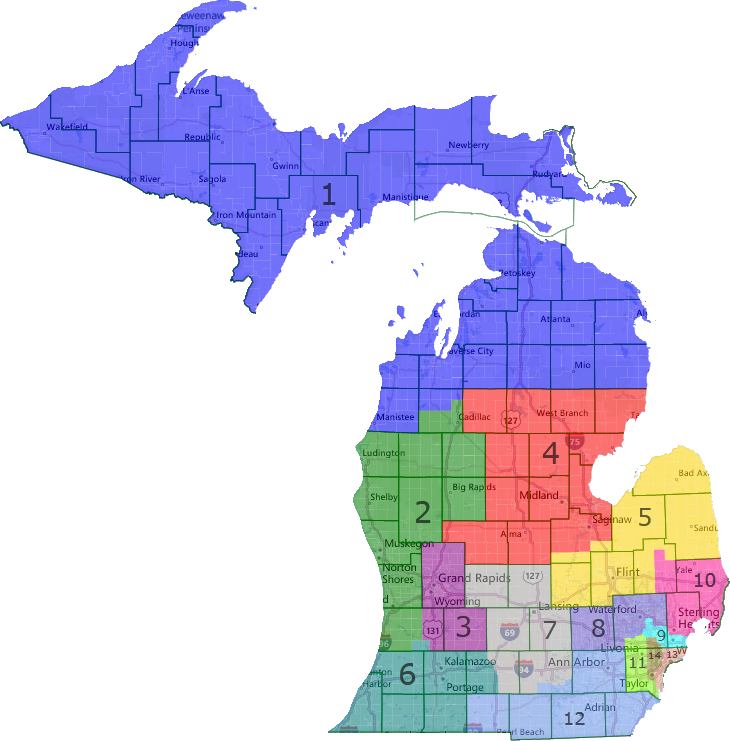
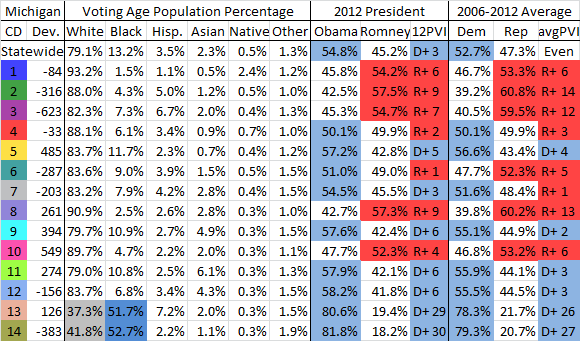
Michigan was drawn by Republicans and is an absolute bonanza when a non-partisan map is implemented which is why we'd be fools not to put an amendment on the ballot next year to do just that. Michigan was one of just 4 states where Democrats won a majority of the vote and a minority of the seats and here that would change. The 1st district remains more or less the same and we really fumbled it by not winning it last year. The 4th and 6th districts though, which had otherwise safe incumbents, get significantly more Democratic to the point where Obama actually carried them last year. We probably wouldn't have won either, but the 4th district in particular is one where Obama relatively underperformed the average and the candidates running where the district lies won 45.3% despite none of its territory being in an actually competitive race last year. We might just have won the 6th though, particularly if Mark Schauer, whose base of Battle Creek is added to the district, decided to run. Upton had his worst showing in a long time last year against a totally underfunded lower tier candidate, yet Democratic candidates won a combined 46% here so it would definitely be within reach.
Moving on, the seats I think we'd actually change the outcome in are without a doubt the 7th and 11th. In the 7th, Tim Walberg gets a Dem leaning district where he'd have likely lost seeing as our underfunded candidates won 47.3% and our bench is incredibly deep here. Had someone such as senate minority leader Gretchen Whitmer run I definitely think she would have won as outside groups like the DCCC absolutely would have targeted Walberg pretty much regardless. Then, we come to the 11th which our Democratic candidates won outright massively and Obama easily carried with nearly 57% of the vote. Given that David Curson, a total stand in candidate, carried a nearly identical if not more Republican district over Kerry Bentivolio in the 2012 special election for Thad McCotters seat, this one becomes a slam dunk, especially if John Dingell ran here.
The flip side of this is that both of Sandy Levin and Gary Peters get drawn into the same district where either Levin just retires or Peters does before he runs for senate in 2014.
Missouri
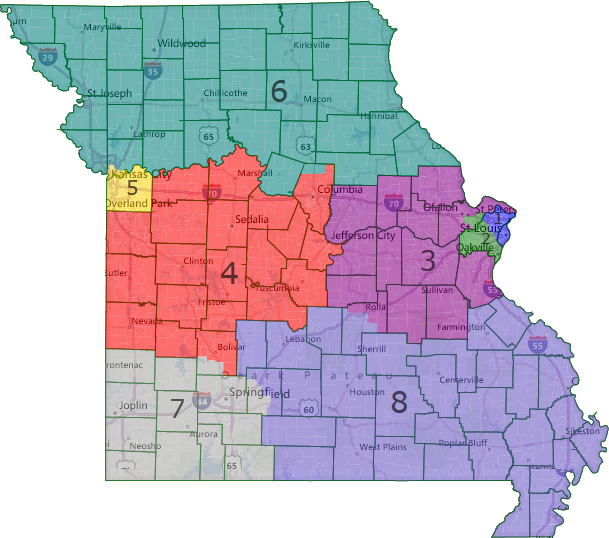
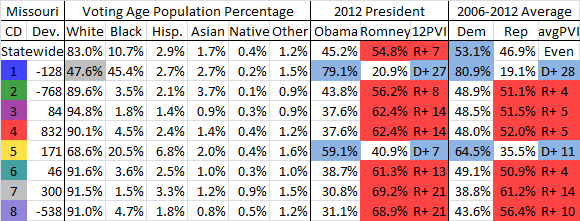
Missouri saw all of the Republicans plus a few Democrats who crossed over vote to override Dem governor Jay Nixon's veto of their gerrymander with his implicit help. However the outrage among Democrats, including myself at the time, is truly misplaced as the partisan effect of that plan was minimal and if anything only shored up the 5th district for us as it only tried to block an Ike Skelton comeback which was never in the cards. Here I've tried to draw a more non-partisan plan though, and aside from the 4th district getting marginally more Democratic yet still solidly Republican, there was really little change. Missouri took a hard right turn in 2012, especially outside of the major cities and as such we stand zero chance at winning any of the other 6 districts. Russ Carnahan got screwed over the instant that Missouri lost a district as the VRA forces the 2nd to become a significantly R leaning district regardless when St. Louis can only support two districts. FWIW, Claire McCaskill did carry everything but the 7th and 8th though.
Nebraska
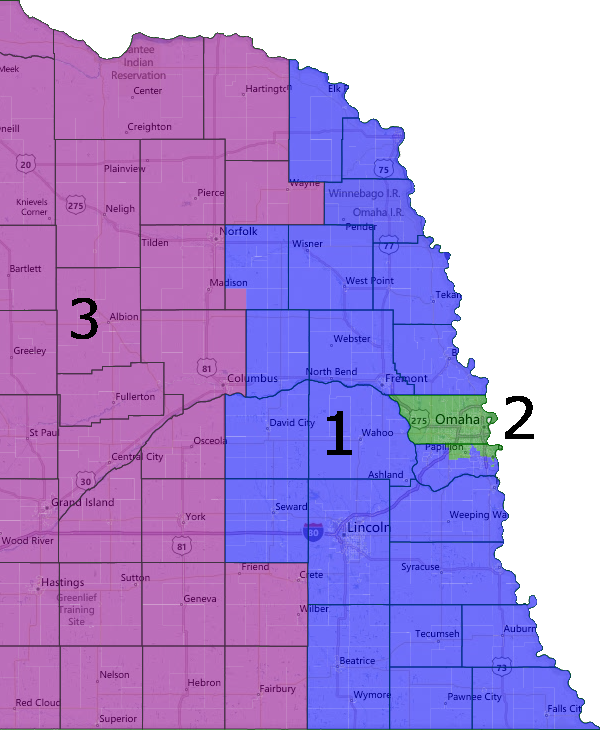
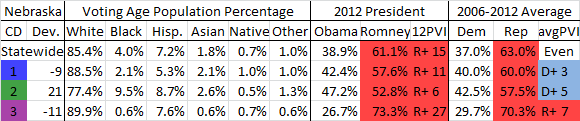
Nebraska saw perhaps the most minimalist Republican gerrymander possible yet it still appeared to have made the difference. The 2nd district is far and away the best for federal Democrats and Republicans made it about 1.6% better for Mitt Romney's margin than this map I've drawn which didn't carve Bellevue and Offutt Air Force Base out from the 2nd in favor of rural Sarpy County. As it turned out, Douglas County Treasurer and heavily underfunded candidate John Ewing came withing that same 1.6% of winning here in 2012 so just using those data points, the race would have been a total coin flip. It gets better though, as the 2nd district was an Electoral Vote that Obama won in historic fashion in 2008 and as drawn above only saw Romney win by 5%. It is certainly within the realm of reason to think that either A) the DCCC/HMP would have helped out Ewing more and put him over the top, or B) the Obama campaign might have invested some in the ground game here as they were already blanketing the airways to reach neighboring Iowa. Either one causes a Ewing win while the district lines themselves might have indeed done so as well. Either way, the seat would be a tossup but I'd put our odds at somewhere over 50%. But wait, there's more! Nebraska has the ballot initiative and if we were really crafty we could try to put an Arizona style commission on the ballot that considered competitiveness (hey it passed in Arizona...) which would put the nail in Lee Terry's coffin and make the electoral vote more competitive.
New Hampshire
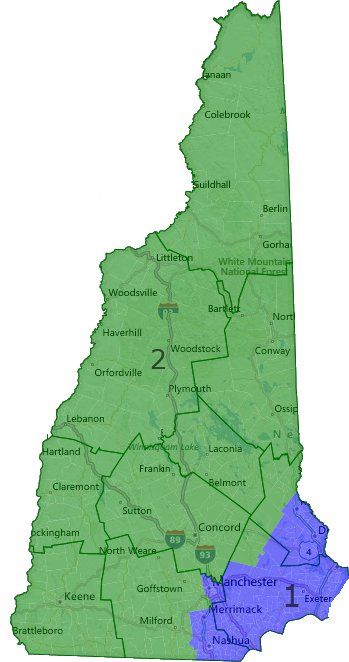
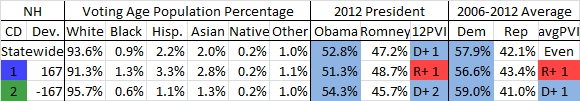
New Hampshire saw Republican legislators use their supermajorities to pass a plan that tried to juggle the demands of two competing Republican incumbents. As it happened, they rather foolishly decided to marginally protect the 1st district and lost both instead of vote sink the 2nd and keep a 1-1 split. Here though, I've reunited the Merrimack Valley (or most of it anyway) in the 1st district which with the presence of Nashua moves it slightly to the left. The partisan outcome change is negligible though as both Annie Kuster and Carol Shea-Porter still would have won last year by about 5 each, but for CSP that would be slightly easier to hold in the future and vice versa for Kuster.
New Jersey
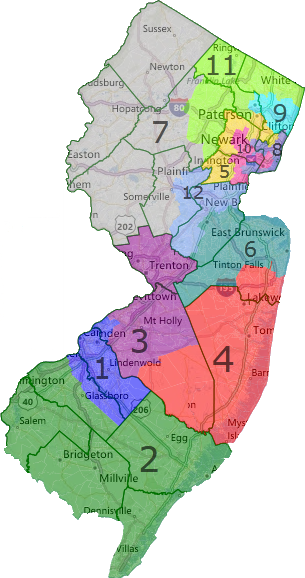
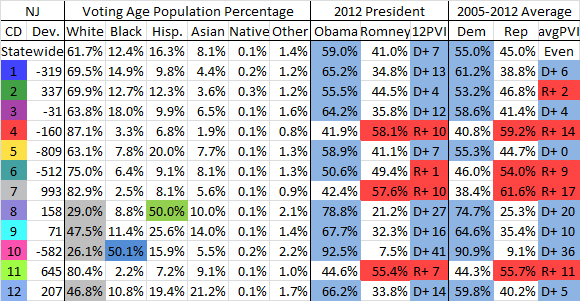
New Jersey is a state which, befitting its image of corruption, has a bipartisan commission that normally functions to just protect incumbents. Normally that is, but instead Chris Christie used the power of the purse to threaten the Rutgers program of normal tiebreaker and redistricting expert professor Alan Rosenthal, causing him to drop out of contention. Democrats then foolishly agreed to the replacement of former Republican acting governor John Farmer who predictably sided with the Republican map as tiebreaker. As such, we got a modest Republican gerrymander in yet another blue state.
In this map, the 3rd district is dismantled and reconfigured to combine Rush Holt and Jon Runyan in a Safe D district. Holt could either run here or in the neighboring Safe D 12th. Frank Pallone unfortunately gets a tossup district 6 that he would have only won thanks to Hurricane Sandy boosting incumbents and his $3 million war chest. It is possible he might have run in the 12th though despite not living there, in which case the district would be potentially harder to hold, though we could run someone less liberal. Scott Garrett gets screwed by being combined with Leonard Lance and his 5th district is reconfigured as a suburban safe D district. Rothman is still combined with Pascrell and might have run there instead. All in all this map likely goes 8-4 last year, but Pallone's 6th would be a tough hold for him.
New Mexico
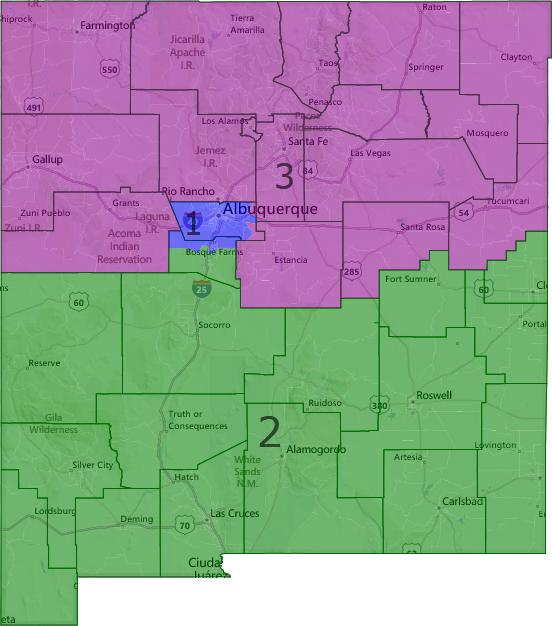
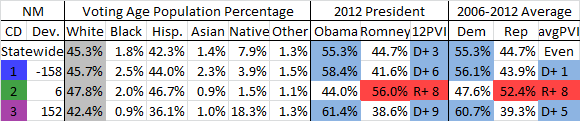
New Mexico was a court-drawn state but saw the court ask the two parties for proposals. Democrats proposed strongly packing the 2nd district, to which the court balked and instituted a least change map. While I'm by no means an expert on New Mexico, I still feel like the actual map isn't quite what a CoI criteria commission would draw. This map is slightly different and splits fewer counties, but the effect is the same of being a solid 2-1.
North Carolina
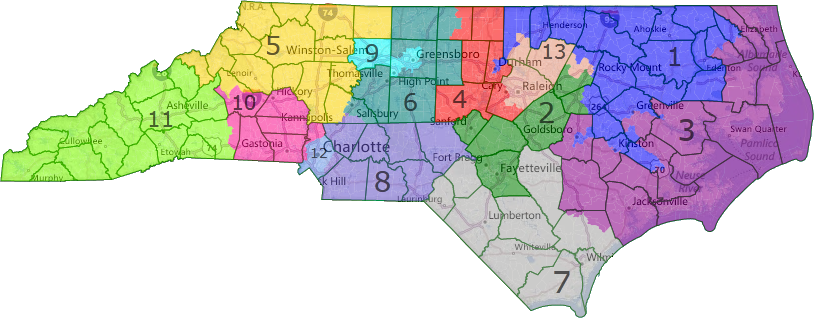
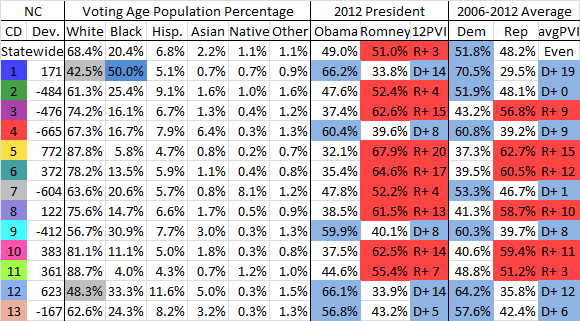
Finally we get to my home state of North Carolina which Republicans disgustingly gerrymandered the living shit out of. The state was one of four to give Democrats the popular vote majority yet nearly gave Republicans a 10-3 advantage if not for a few hundred votes. Predictably, a non-partisan map causes them to lose big and there's no downside to Democrats. Mike McIntyre gets a much safer district he'd have held with ease, while the disgusting I-85 Charlotte to the Triad gerrymander is dismantled. Mel Watt gets a safe compact Charlotte district while the 9th disappears and is reconstituted as a compact safe D Triad area seat. Brad Miller also sees his district revived as a safe D Wake County-centric seat without hurting David Price. Renee Ellmers gets a much more Democratic district similar to the old 2nd which she barely won against a tarnished incumbent in 2010 of all years. If Larry Kissell, who represented much of Fayetteville, had decided to run here I think he'd have won relatively easily, but regardless I think that the Dems win so long as Bob Etheridge wasn't hopelessly destroyed by his "who are you!?!" moment. Obama won 47.6% here but relatively underperformed and Democratic candidates won 49.3% here despite not running competitive campaigns in all but one county in the district. Finally, we get to the 11th which is just about a slam dunk for Heath Shuler, who only retired after his district was destroyed in redistricting. Our underfunded Democrats won roughly 49% here and with Shuler's 3 term incumbency and wide win in 2010, there is practically no chance he'd have lost. In all that results in D+4 and a return to 8-5 largely thanks to the strength of our incumbents.
Ohio
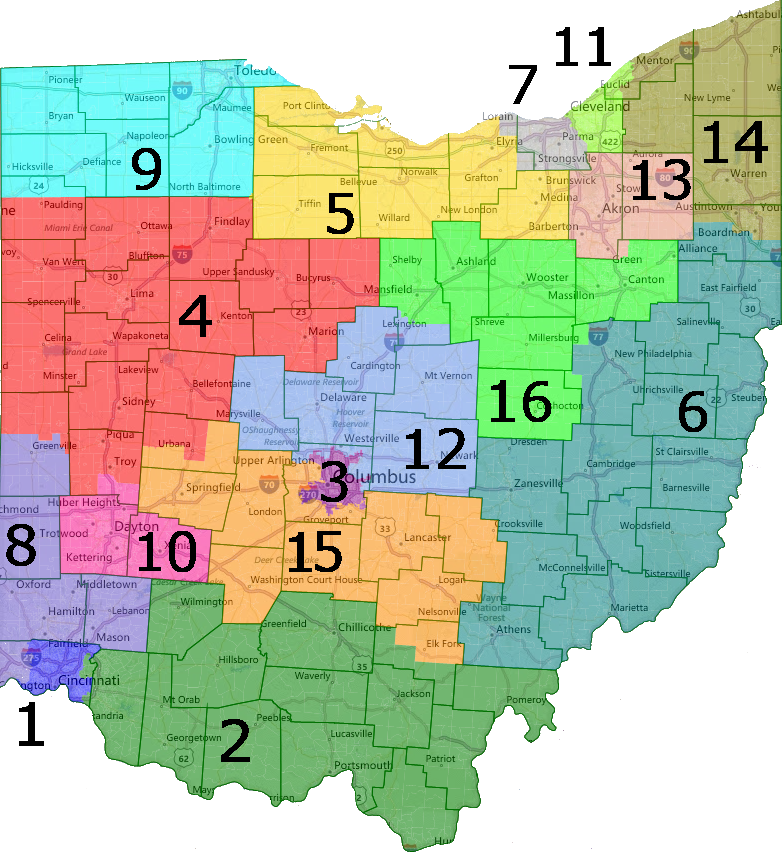
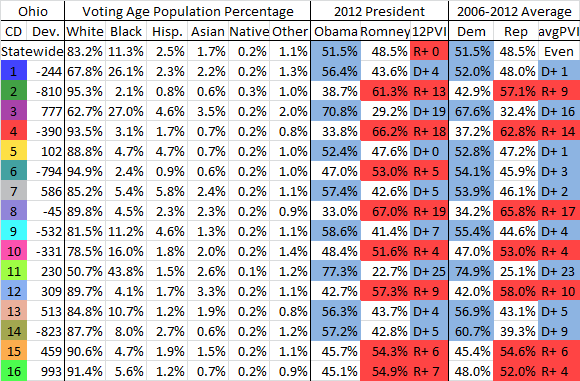
More than any other state, Ohio probably yields us the most seats when we dismantle the Republican gerrymander. This was a state where Dems won roughly half the vote yet got 25% of the seats. So starting off, we have the 1st district which contracts to just Cincinnati and its inner suburbs and goes from a solid Romney district to one where Obama won over 56%. Our total sacrificial lamb candidates won a combined 49% here and if someone like former Rep. Steve Driehaus or Cincinnati mayor Mark Mallory ran this would be a relatively easy pick up against the hard right Steve Chabot. The rest of the southwest and center of the state are relatively the same, but it's the north and east where we have a field day. Without the Toledo to Cleveland Gerrymander, the 9th is unpacked and the 5th becomes a marginally D+ district that we'd have picked up with a competent campaign in the political environment that was 2012; indeed our candidates won 54% there in 2012. The 6th district also moves left enough to be a coin flip for the recently deceased Charlie Wilson (meaning that a special would have been required had he won but that's another story). Wilson lost by just over 6% and the district gets over 3% better and has more of his old base in the form of his state legislative districts in it, which leads me to believe he'd have narrowly prevailed over Johnson and certainly would have gotten more DCCC funding as a strong former incumbent.
Moving onto the northeast, we see the LaTourette-mander dismantled with the northeast corner merged with the Youngstown area. Since LaTourette retired, Tim Ryan would have wiped the floor with David Joyce in this 57% Obama district. Adjacent to it, Betty Sutton's Safe D Akron district is revived where she'd have cruised, while unfortunately Dennis Kucinich, last seen becoming a Fox News contributor and flirting with running in Washington state, gets his West Cleveland district back. Still, even Kucinich would have a hard time losing this 57.4% Obama district though it's not guaranteed he'd have even won the primary. Finally, I emphatically do not believe that the 11th should be required to racially gerrymander its way down to Akron to be majority black. Racial polarization here is far lower than it is in places like the Deep Southern states and at 44% black would still easily allow black voters the ability to elect the candidate of their choice, who happens to be Marcia Fudge (who is black).
Sadly a map like this almost happened with Ted Strickland losing by just 2% in the most heartbreaking loss of 2010, but Ohio is a state with the ballot initiative and as with Michigan it would be criminal if we didn't try to get an amendment on the ballot to re-redistrict.
Oklahoma
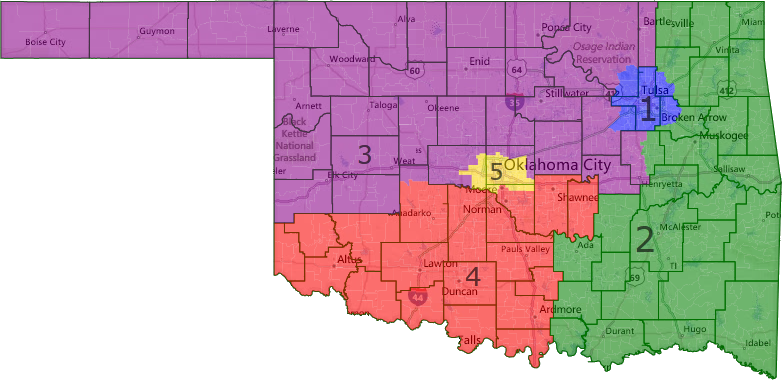
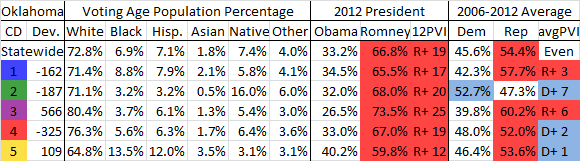
Oklahoma is similar to New Mexico in that the partisan impact of the line drawing was minimal, but the map still has vestiges of the 2002 remap when the state had to cannibalize one of its districts. Here I've made both the 1st and 5th more compact and urban with the 1st containing pretty much all of Tulsa and its suburbs and the 5th containing the entirety of Oklahoma City (which spans three counties) even though they double cross counties. The partisan impact is negligible, so this one's just for completists. Republicans drew the actual map, but if anything its Dem friendly as they didn't try to crack the 2nd, not that they needed to. An alternate map could have kept all of Oklahoma County whole if you were concerned about county splits.
Oregon
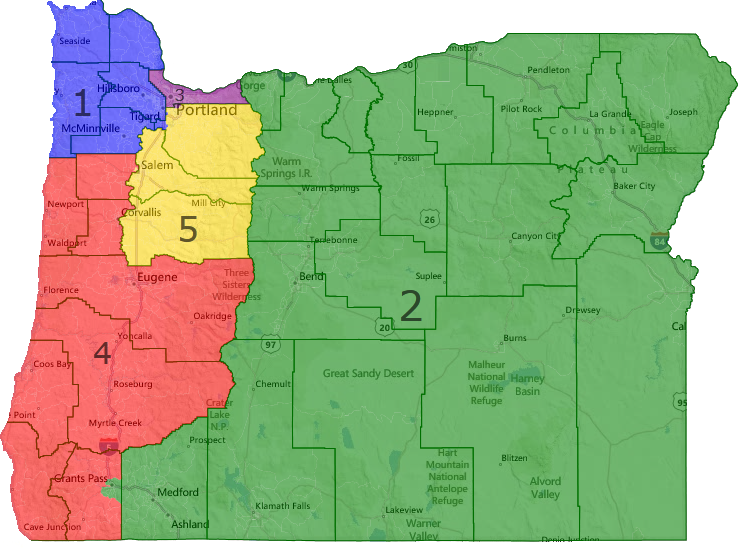
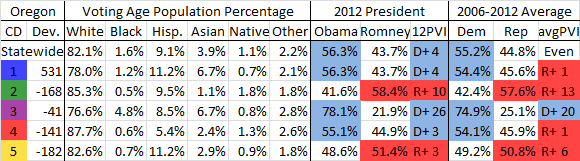
Oregon saw Republicans largely roll over and vote for a mildly Dem compromise map. This map attempts to undo what little gerrymandering there was and as such sees the 4th district get a little more Dem at the expense of the 5th, which becomes a narrow Obama'08/Romney'12 district. Kurt Schrader is very well entrenched though and would have had no trouble winning, making this map still 4-1.
Pennsylvania
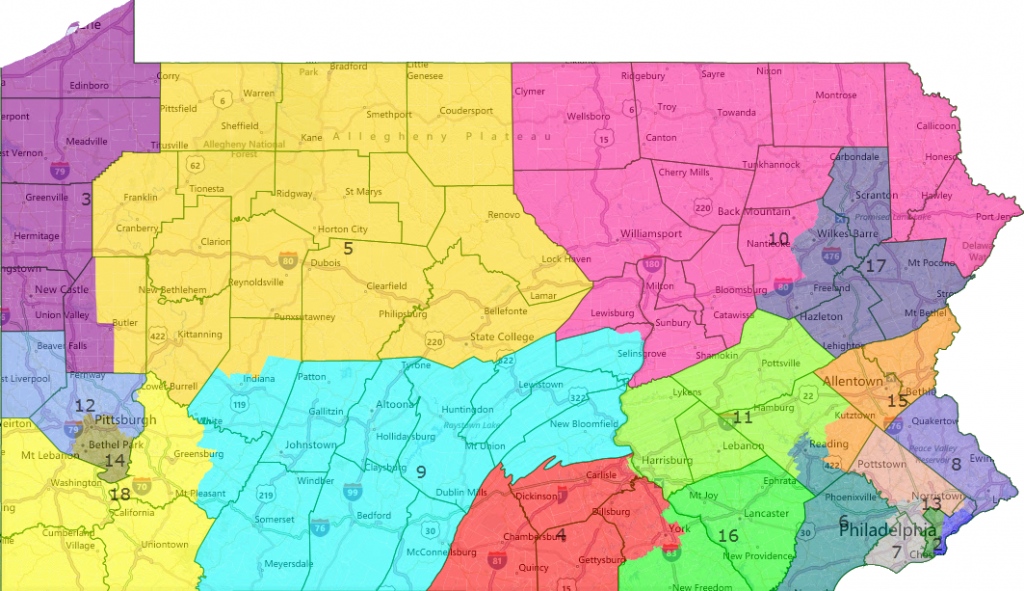
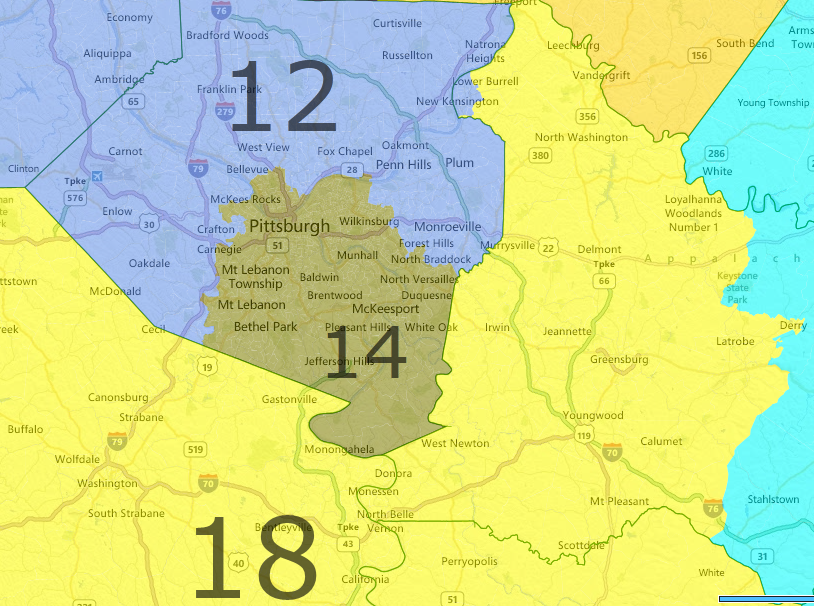
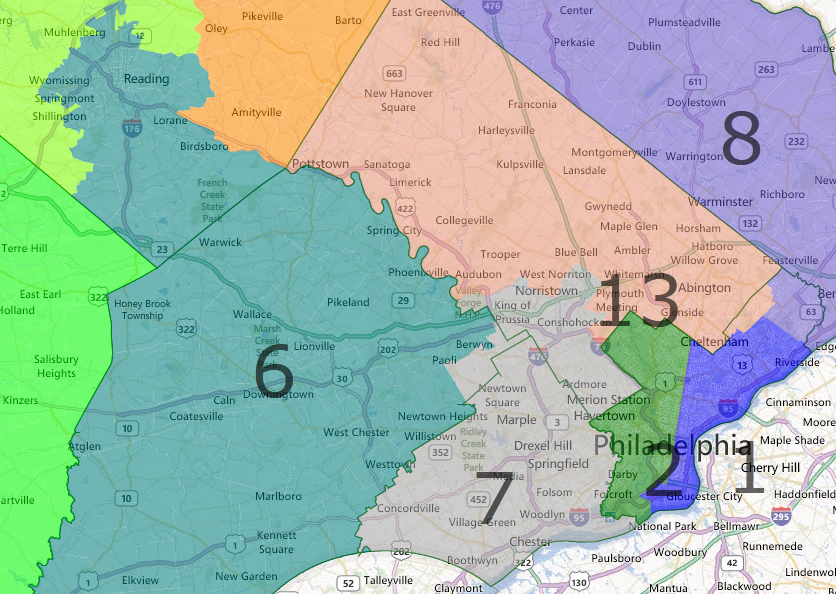
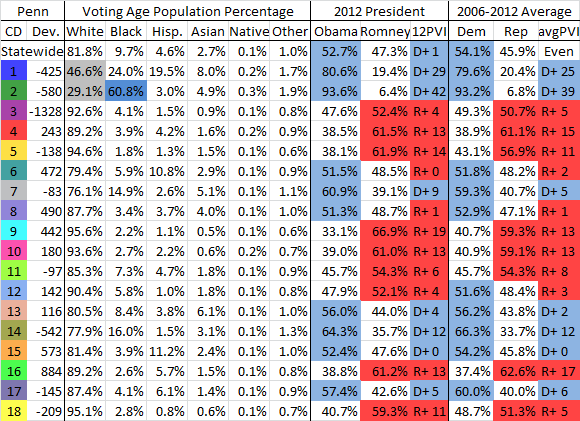
Pennsylvania was easily the most fun to draw out of this entire set just because of how obscenely gerrymandered into Rorschach blots the actual map is. Like Ohio, it is also a bonanza for Democrats being one of the four where we carried the popular vote yet got just 5/13 districts. Starting in the west, Jason Altmire gets a district comprised of Beaver County and the northern Pittsburgh suburbs that he would have held onto easily as an entrenched incumbent (even Critz carried it despite not being his base). Mike Doyle's 14th then takes all of Pittsburgh and the southern Allegheny suburbs. Instead of running in the 12th, Critz gets combined with Tim Murphy in the 18th where he would have lost by a wider margin. Fortunately for Dems though, the 3rd becomes within reach as it is a narrow Romney district and Obama carried it in 2008. Despite being woefully underfunded, our candidates still won 46% there thanks to the reunification of Erie and with a better candidate or more funding could have kept it closer though probably not breached the 50%+1 mark.
Moving on to the east of the state, Tim Holden sees his old district essentially resurrected in the form of the 11th which he held with ease in 2010 and would be Safe D. Matt Cartwright still wins in the D+5 17th district, giving us a gain. Next, without the cracking of Allentown, Charlie Dent gets a D+ district where our candidates won 47.3% despite being sacrificial lambs and I think with a stronger candidate like 2010 nominee John Callahan would have pulled it off. Dent had never faced a serious challenge until that year and only pulled in 54% then. Democrats would have been licking their chops to face such an incumbent again in what was essentially the same district and with his voting record I don't see him winning a district where Obama won by nearly 5%, however it would certainly be a tossup at best and could have certainly gone the other way with a bad Democratic campaign.
Next we have the 6th which is comprised of Reading and almost all of Chester County. Though this is a bit of a leftovers district, it's almost impossible to put Reading anywhere else that makes more sense overall. It's still a fair amount more Republican than the district Gerlach held from 2002-2010 and Dem candidates won just 45.6% there. However, Obama carried it by 3% and Manan Trivedi wasn't exactly what we'd call the DCCC's preferred candidate, but I still think Gerlach holds on with his incumbency. Where the dynamite explodes though is in the 7th, which by regaining all of Delaware County becomes totally unwinnable for Pat Meehan at nearly 60% Obama. No matter how this district is drawn, Meehan is DOA. Nearby, Schwartz gets a somewhat less Dem but still solid seat with the remainder of Montgomery County and a tiny section of Philadelphia. Finally, the 8th district becomes slightly more Democratic but Fitzpatrick held on with ease last year so this one's Lean R more likely than not at best.
Rhode Island
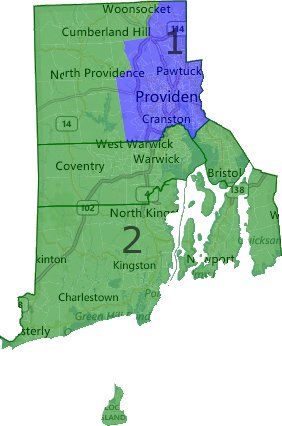
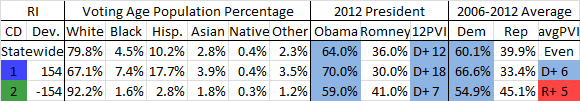
Like neighboring Massachusetts, the Democrats' Rhode Island map didn't change the partisan outcome and if anything made electing a Republican more likely by cracking Providence. Here, David Cicilline gets the rest of the city and its closer suburbs like Cranston and towns like Pawtucket. As such it goes all the way up to 70% Obama and Cicilline would have won easily while the 2nd isn't remotely Republican enough to endanger Langevin.
South Carolina
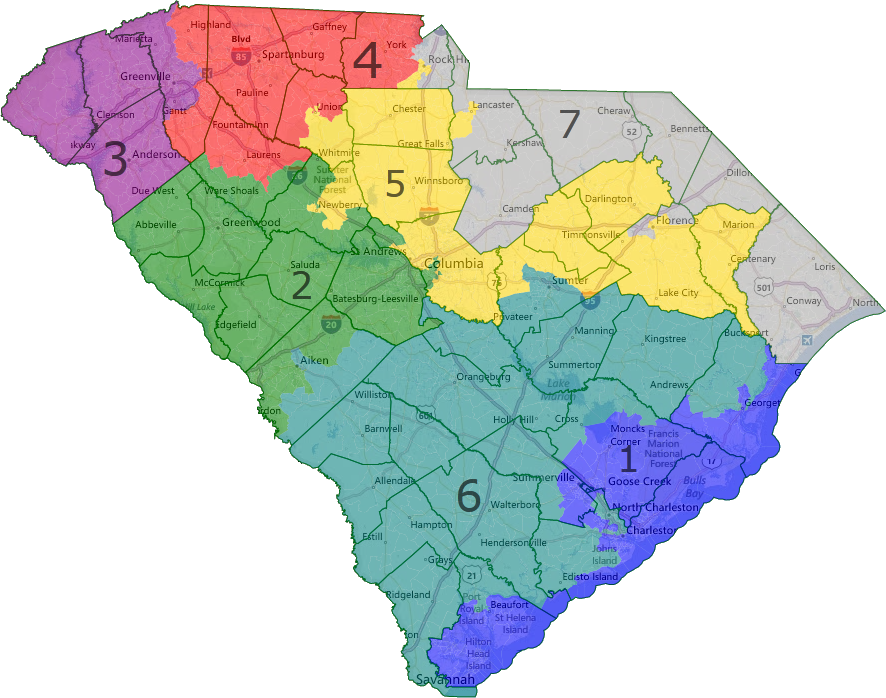
South Carolina is the final of the three Deep South states where I believe Republicans should have been forced to draw a 2nd VRA district and presents the strongest case of the three. It is incredibly easy to cleanly draw 2 black majority districts without making mincemeat of communities of interest and looks no uglier than the actual Republican gerrymander. Here I've drawn the black belt plus Charleston as one and the remainder of the black belt plus Columbia as another while splitting as few counties as possible. Both districts are Safe D while the 5 others are all Safe R.
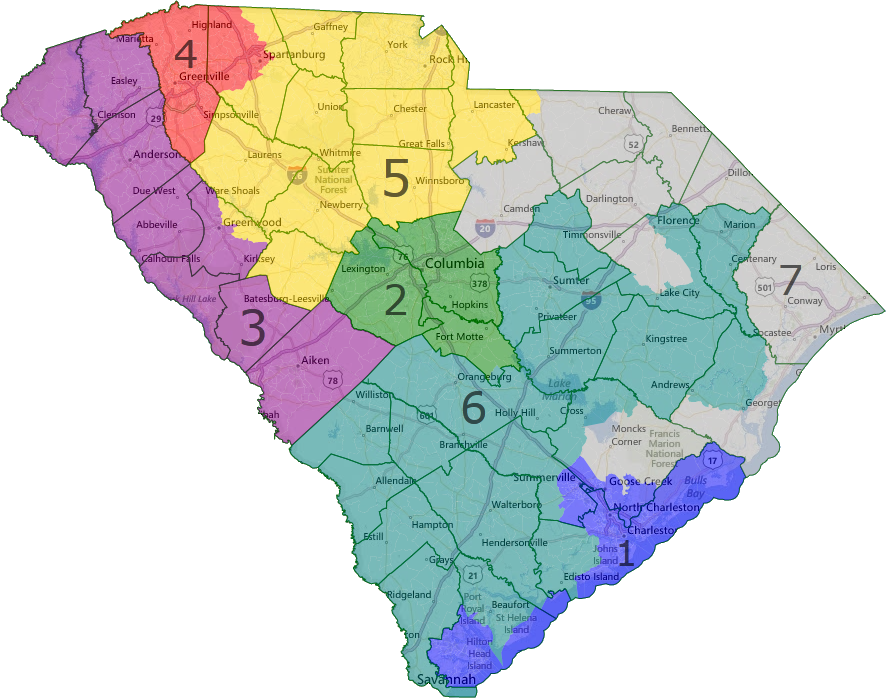
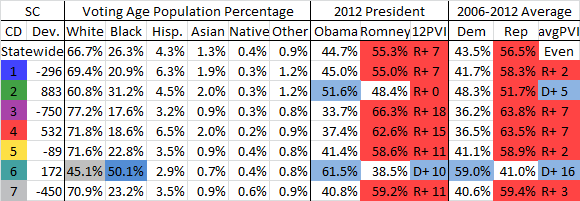
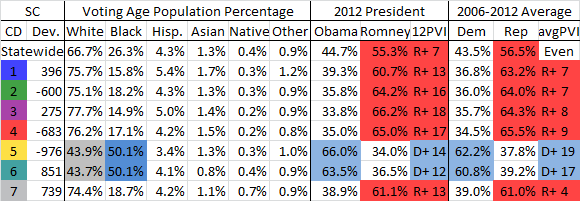
If a 2nd VRA district isn't forced, Democrats actually about as well with an additional opportunity as it's very easy to draw one entirely rural Black Belt VRA district with a compact Columbia seat and a compact Charleston seat, the first of which is about an Even PVI Obama district and the latter a more Republican leaning seat, but still a good deal less than the actual one. Joe Wilson, who only won by 9 in 2010 of all years couldn't win a district Romney lost by 3, while Mark Sanford would have been a true coin-flip against Elizabeth Colbert Busch in the May 7th special election seeing as his district gets over 4% more Democratic. The main difference in partisan outcomes is that the 2nd is now vulnerable in midterms, but would be fairly solid for Democrats in presidential years. That makes for 3/3 Deep South states where, though my personal preference is a 2nd VRA district, not adding one doesn't cost Democrats any seats.
Tennessee
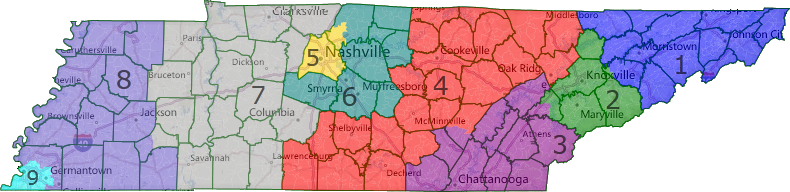
Similar to Oklahoma, Tennessee is a state where Republican gerrymandering didn't change the partisan outcome at all (though if anything they could have cracked the 5th). The 5th and 9th are still safely Dem while the 4th is still too Republican for us to take advantage of DesJarlais' scandals. I will say though that aesthetically this is one of the prettiest maps I drew with respect to CoI and city/county integrity.
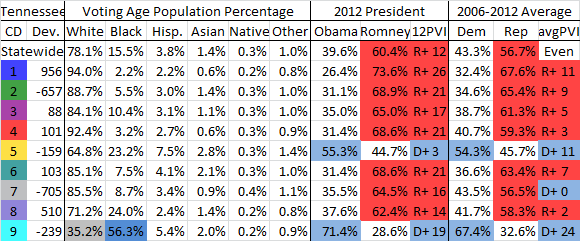
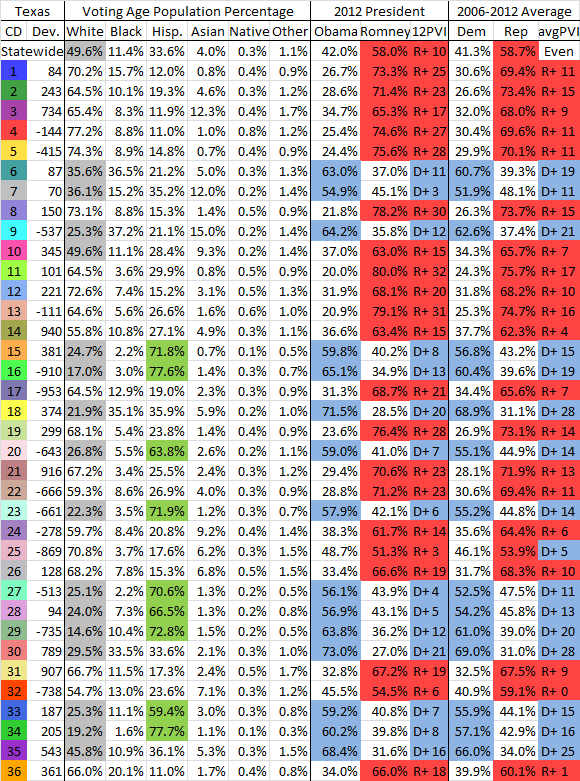
Texas
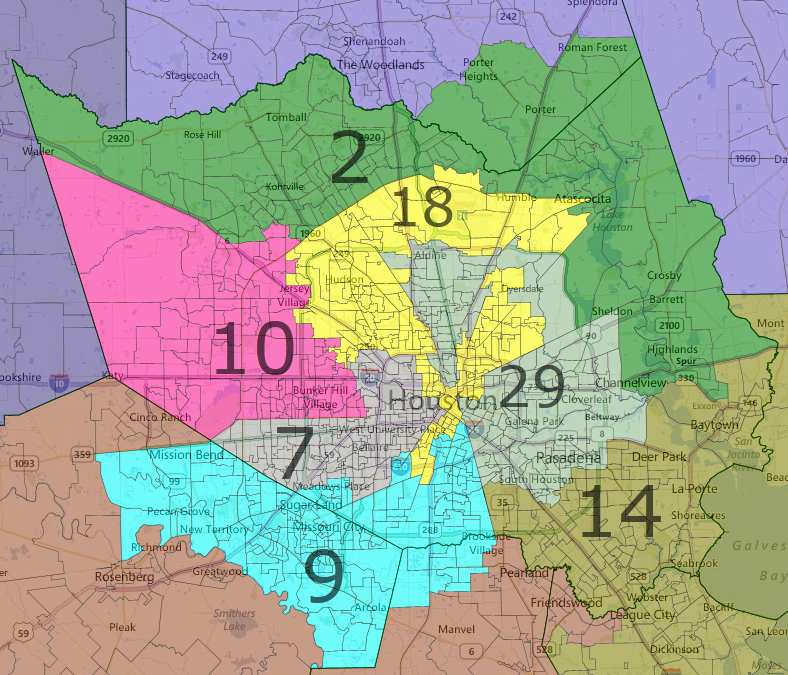
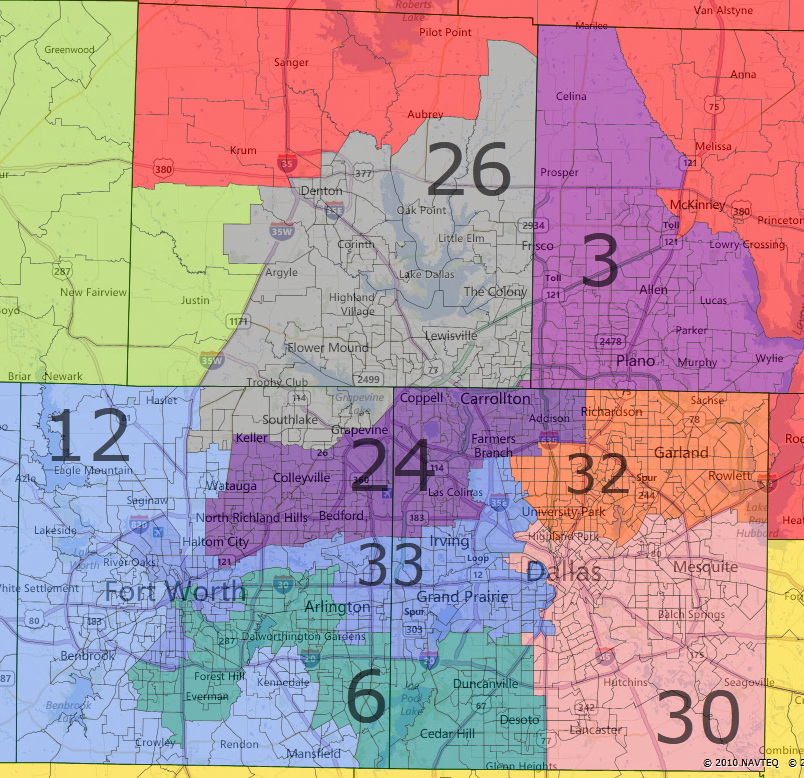
This map was drawn by my fellow DKEr and Texas politico/political scientist wwmiv as Texas is a VRA disaster to try to draw cold. Still there are plenty of proposals out there from interest groups that were effectively similar to this.
Texas is a state that Republicans gerrymandered so aggressively they got slapped down by the federal courts, only for SCOTUS to intervene and somewhat aid them. This map undoes all of their ridiculous districts such as the Houston to Austin Rorschach blot. It also does what I've done in other states and draws additional VRA districts that I believe should be required and where court cases are still pending to that effect. In particular, the 27th becomes a Spanish Surname Voter Registration (SSVR, a proxy for citizen voting age population) majority VRA district that Blake Fahrenthold, Mr. Duckie Pajamas would have lost big. Also in South Texas, Pete Gallego gets a Safe D district that Obama carried with ease by undoing the San Antonio gerrymander. In Austin, with the dismemberment of the 10th district and McCaul's likely run in the safe R 10th in Houston if he wants to win reelection, the new 25th district is a narrow Romney district and a total tossup. Still, the seat would be open for Roger Williams and with a well-funded Blue Dog we should be able to win it, especially if Obama nearly carried it.
Traveling on to Houston, we see that Nick Lampson gets screwed over to the point where the Galveston based district is totally uncompetitive. However, the Houston based 7th district becomes safe Dem at 55% Obama, all while the 3 VRA districts are preserved. Moving on to Dallas, Dems gain a district that should have been forced in the form of the black majority CVAP 6th district. Marc Veasy would probably run there, opening up the 33rd to a Hispanic candidate now that it is 59% VAP and a coalition district at CVAP, especially with the black population much reduced there. All in all this gives us +3-4 in the state.
Utah
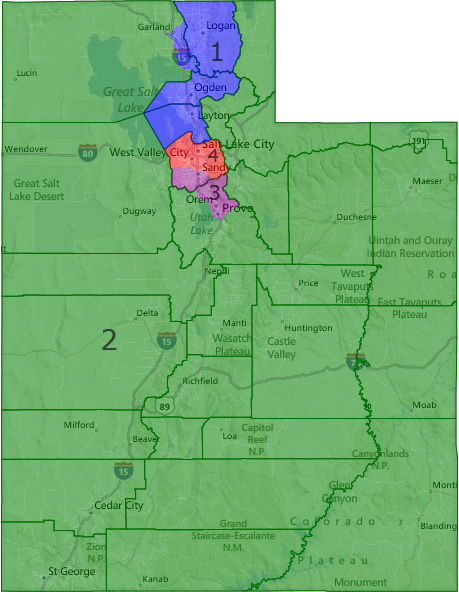
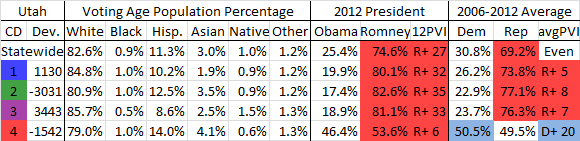
Utah Republicans drew a bit of a dud gerrymander when, in the most Republican state in the nation, they allowed Rep. Jim Matheson to cheat political death once again. Here though, he likely meets his demise in the primary as the 4th district is a genuinely liberal seat. Romney's % predictably inflates Republican strength, but Obama won 57% here in 2008 and our House candidates easily carried it. But since that includes Matheson who might not have been able to sufficiently pivot left, even our senate sacrificial lamb carried it against longtime incumbent Orrin hatch which should give you an idea of how Democratic it is. All three of the remaining districts become the most Republican in the nation thanks to Republicans' hyper-density and Romney's Mormonism native son boost in Utah.
Virginia
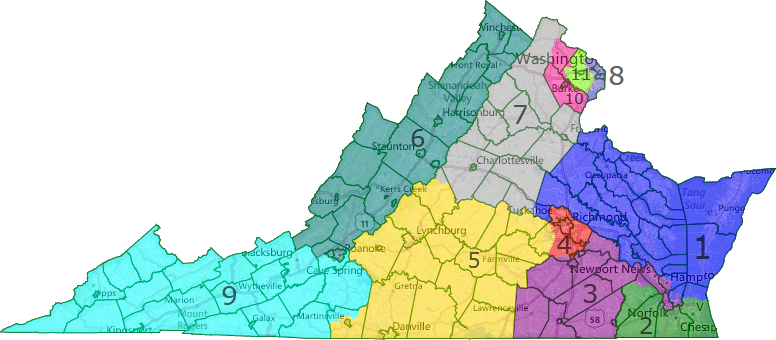
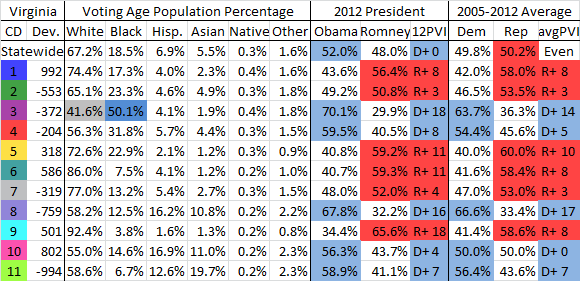
Virginia is a state where we came heartbreakingly close to blocking a Republican gerrymander in 2011 when we lost the state senate by a mere couple hundred votes thanks to our particular gerrymander of that chamber backfiring. As such Republicans gerrymandered an 8-3 split in a state Obama won by 4%. Here, I've dismantled the ugly Hampton Roads to Richmond gerrymander in favor of a compact Richmond seat and compact Hampton Roads + Southside VRA district. I admit I'm not entirely sure how a commission might draw this area as it's possible that the 2nd district, which here is roughly Lean R, could get either more or less Dem. Either way though, we'd get an extra safe seat out of Richmond. The 2nd would also make for an awesome fight between evangelical fundie Randy Forbes and 'RINO' Scott Rigell. At 49.2% Obama it's not inconceivable that we might have defeated Forbes, but I'm not particularly hopeful here as it's possible the seat could get more conservative depending on how Hampton Roads is drawn.
In Northern Virginia, Frank Wolf, who is getting up there in years and might have retired in favor of state legislator Barbara Comstock, gets a 56.3% Obama seat where Kaine likewise won a similar percentage. Dem House candidates actually carried the district, and while Wolf is a strong incumbent he has also not faced a serious challenge in a long, long time and has nothing but a conservative voting record and the seat is roughly half new to him, diminishing his incumbency. Not a single Republican won a district where Obama did that well last year and I think we'd have knocked off Wolf with a well funded nominee and cruised here if he retired. Gerry Connolly keeps his safe seat though it's less packed, but Eric Cantor gets absolutely screwed by dropping his conservative white Richmond/suburbs base and gaining Charlottesville (where the hell else would you put it?) in a district that voted for Obama in 2008 but Romney carried by 4% in 2012. If Cantor is the Republican nominee, we carry the district plain and simple, but I'd imagine he just retires or runs in the 5th as he knows he's toxic in a swing seat. Luckily for Democrats, we have a fantastic candidate who nearly won a district 2% redder in 2010 of all years and whose entire base is in the district: none other than Tom Periello. I feel pretty good about us winning this district anyway as it only narrowly voted for George Allen despite his old congressional district and electoral base having very significant overlap with it.
The 5th gets much more Republican, as does the 1st to the point that they're unwinnable. Finally, from an aesthetic standpoint I love how the Shenandoah Valley fits almost perfectly into the 6th and Appalachia + the Blue Ridge fits almost perfectly into the 9th.
Washington
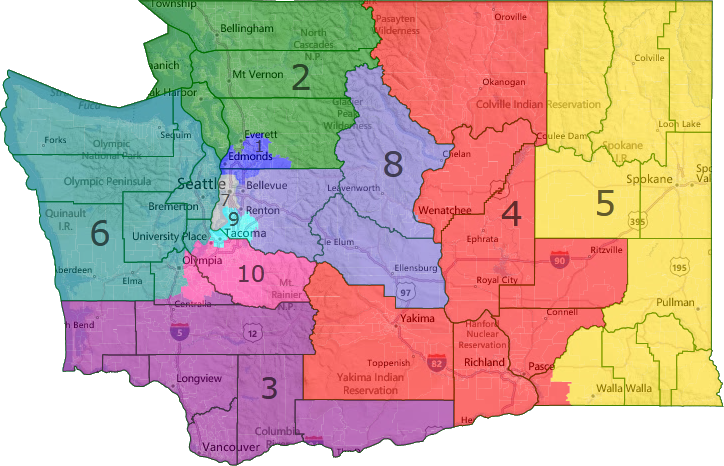
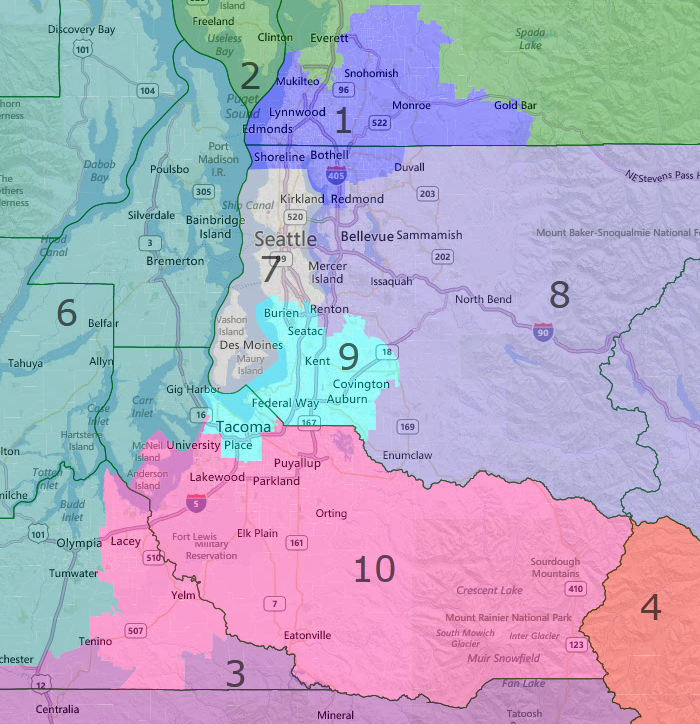
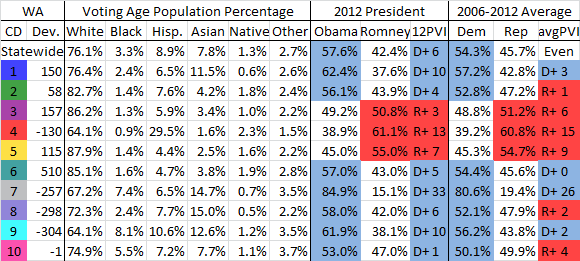
Here we have another state with a bipartisan commission and unlike in New Jersey, where the tiebreaker voted with Republicans to screw over the Democrats, here we just had a Democrat vote with Republicans to screw over the Democrats. This is largely because, even more so than the New Jersey commission, the map was pure incumbent protection and after 2010, incumbent protection has a GOP bias. So here's what my best guess as to what a California-style commission might draw. Note that districts 3-5 are all pretty much the exact same as the actual map.
The difference though comes in the Sound districts with the 6th dropping Tacoma in favor of Olympia and the 8th dropping Pierce County. I see no reason why it should have Pierce in addition to Seattle suburbs and with that it goes up to 58% Obama and dooms Reichert, the main difference in the map. Unfortunately though the 10th becomes just mildly Dem leaning, but Denny Heck performed very well in a redder seat in 2010 and I have no doubt he'd have won here last year. Finally, the 1st and 2nd switch partisanship largely by becoming more similar to their prior configurations, meaning that Suzane DelBene would have taken on Reichert in the 8th and someone else would have won the 1st. Obviously there are many ways to draw King County, but it is by dropping Pierce that Reichert is doomed.
West Virginia
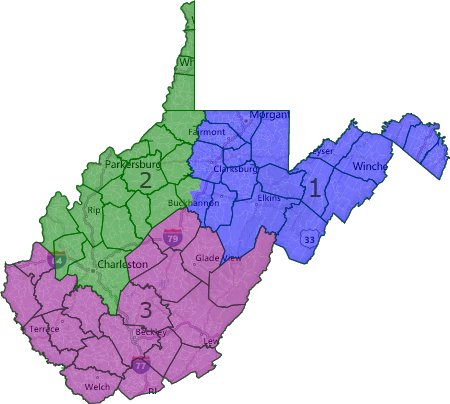
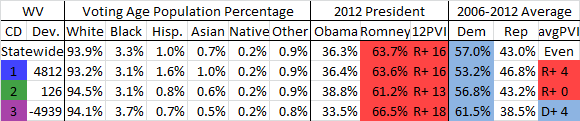
West Virginia is the final state where Democrats drew the map and rather than draw a partisan gerrymander, they maintained the 1990s geographic gerrymander that was designed to protect then 1st and 3rd district Reps Alan Mollohan and Bob Wise from a primary challenge from 2nd district Rep. Harley Staggers when the state lost a district during reapportionment. Here I've undone that with a more geographically and regionally compact map. Ironically the 3rd gets ever so slightly more Democratic thanks to the loss of Mason County on the Ohio river in exchange for Braxton and Clay, two coal heavy counties. More than any district in the entire United States, the 3rd sees the largest divergence between presidential performance and all other Democrats' performances due to the issue of coal (it's THE heart of coal country), but with the state trending Republican and the Democratic party moving away from fossil fuels and natural gas killing coal, our days are numbered here despite heavy unionization. The 2nd though would have been more competitive in 2014 with Shelley Moore Capito running for senate as instead of being R+2 compared to the state it's just barely more Republican thanks to having both Charleston and Wheeling. The overall outcome is the same 1-2 split we saw in reality though, just with Rahall winning slightly more comfortably than 8%.
Wisconsin
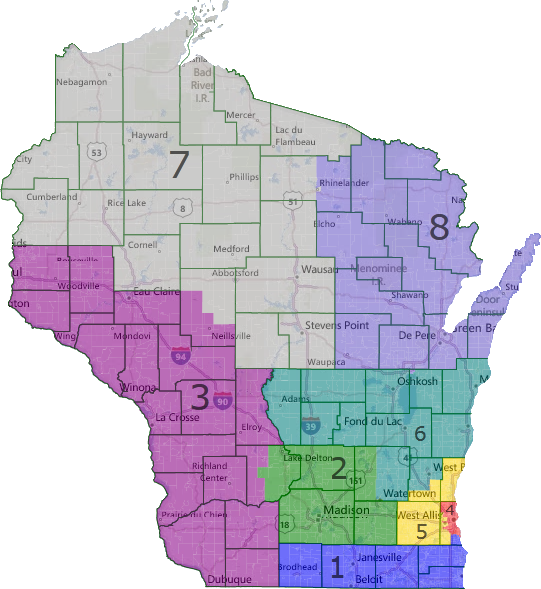
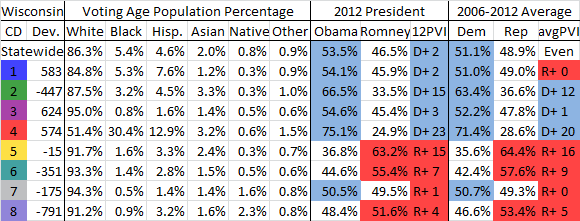
Our final state is Wisconsin, which Republicans gerrymandered to effectively produce a 5-3 split in the last of the four states where Democrats won the popular vote but a minority of the seats. In this map, Paul Ryan gets screwed over with a D+2 district that Dem candidates actually carried. I think Ryan would have retired to be just the VP nominee and then cash out to a think tank or as a lobbyist after Romney lost, but if he didn't this one would have become a massive money sink though we'd have ultimately won it. This seat probably would have seen a stronger candidate than the liberal Rob Zerban run, but Ryan is just unelectable in a seat like this that's 6% better for Dems than his actual one. The other seat we likely gain is the Northwoods based 7th which regains heavily Democratic Stevens Point and with it the home and base of Sean Duffy's 2010 opponent, state senator Julie Lassa whom Republicans specifically drew out for fear of a rematch thanks to her Dem heavy base in Stevens Point. With this bluer district that Obama carried yet nonetheless underperformed in, a stronger and better funded opponent in Lassa, who seemed like she wanted to run again and has nowhere to go in the state senate minority, and a district where even our 2nd tier candidate won 48%, Duffy would have lost though kept it close. Reid Ribble However keeps his district more or less the same, while Ron Kind's gets somewhat more Republican but he massively outran Obama and would have been fine.
Candidate Quality
Overall, I don't want to assume we'd get 1st tier candidates in every race, so there's nothing in here like Brian Schweitzer running for Montana's open seat, but it can't help but be emphasized just how much the prospect of the majority influences candidate recruitment. We see it all the time in state legislatures and we certainly saw it in 2010 where tons of deadwood washed up on the shore because serious Republican candidates sat out the early cycle. As such there are two districts in particular that, though the lines wouldn't have changed at all because of implementing non-partisan maps, are nonetheless worth highlighting.
CA-21 This was essentially Jim Costa's old seat seeing as he represented 3/4ths of it and only fled to the even more Democratic 16th when his buddy Dennis Cardoza retired and resigned. I am of the belief that Cardoza only retired because there's no point serving in the minority when you can cash out and become a lobbyist/sell your influence. Obviously this is unknowable without asking Cardoza himself, but being in the majority is a very strong enticement and if he ran, Costa would have run in the 21st and it would have been a slam dunk.
Even if Costa didn't run there though, that same enticement would still apply to our actually not too shabby bench here. Regardless, I see very little chance of us forfeiting the election by nominating the ethically challenged some dude John Hernandez who spent only $100k and accordingly lost big. Any competent Democrat who could have raised $600k would have won as Republicans just were not winning Democrats where Obama won nearly 56%, especially not as non-incumbents.
NY-11 If the prospect of the majority brought better candidates, it's possible that Mike McMahon would have sought a rematch in the State Island based district. I believe, along with other observers, that he would have won had he run as our actually challenger Murphy raised little money and was an otherwise poor candidate. I have no idea whether McMahon would have run or not so I'm certainly not including him in my estimate, but it's at the very least something to consider.
OK-02 Being hopelessly in the minority and seeing his district shift out from under him was probably the determinant factor in 4 term Rep. Dan Boren retiring in this ancestrally Democratic district (which still has a huge Dem registration edge). Given that he's not even 40 and could easily have waited until Dems regained the majority with seniority, I'd have to bet that the second factor played the bigger role. Boren only won by 13% in 2010 over a totally unfunded nobody and he'd have certainly been the top Republican target in 2012. Perhaps he might have been enticed into running again if it looked like we could take the house, but even so I really don't see how he'd have won considering our touted nominee Assistant US Attorney Rob Wallace spent over $1.2 million and took all of 38% of the vote.
This same principle applies nationwide, but much more so than alternative districts where we can look at actual election data, is mostly unknowable but still worth our consideration.
Bonus Map
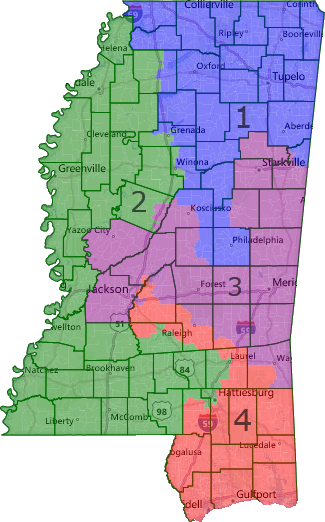
In case you didn't get enough ;) here's one extra where I drew Mississippi (which had a court-drawn map) with two majority black VAP districts. Each is at 50.6% black and over 57% Obama last year, but I'm torn as to whether or not this could have been required and without it the 3rd is uncompetitive.
Conclusion
So that wraps up what is a very lengthy diary that I hope you all still enjoyed. If I had the time and resources I would attempt to turn this into an actual academic paper with a more thorough justification for my alternative maps and perhaps things like interviews with experts/candidates, but as just an undergraduate student that's a little bit above my pay grade. Still, we should all be infuriated that our system is so stacked against us and should act to help alleviate this bias by again organizing independent redistricting initiatives. Helping to do so will be my next project now that this is largely done. So thanks for reading and I welcome your thoughts and well-reasoned critiques in the comments.
2:02 PM PT: Wow recommend list, thank you all :D

