The Standing Rock Sioux and the elections
Even as the presidential election campaign raged on, one storyline that drew the attention of many progressive activists and sympathizers nation-wide over the last few months was the resistance of the Standing Rock Sioux tribe against the Dakota Access Pipeline, and the police violence the NoDAPL protesters faced. Just last night, again, terrible scenes played out as the police doused protesters with water cannons and tear gas in freezing weather; more than 160 people were injured. I don't really know more about their cause than anyone else who's read the occasional news report about it, but it made me curious about how the election turned out there.
Two counties are entirely part of the Standing Rock Native American Reservation: Sioux County, North Dakota, and Corson County, South Dakota. Only Sioux county has an overwhelmingly American Indian population, though (81%); Corson is over 36% white. So I started by looking up the presidential election results in Sioux county, ND.
Turns out Hillary Clinton won easily: 64% to 22% for Trump. That also turns out to be a significant setback for the Democrats compared to 2012, however: Obama had defeated Romney by a massive 79% to 20%.
Trump didn't benefit, getting just 33 more votes than Romney, but Green Party nominee Jill Stein scooped up 11% of the vote. Those votes likely reflected the Green candidate's local engagement; Stein and her running mate Ajamu Baraka were faced with arrest warrants in early September for their participation in the NoDAPL protests.
Sioux County, ND
|
|
Democrat |
|
REPUBLICAN |
|
other |
|
(of which green) |
|
| 2012 |
|
900 |
78.7% |
225 |
19.7% |
19 |
1.7% |
6 |
0.5% |
| 2016 |
|
758 |
61.5% |
260 |
21.1% |
214 |
17.4% |
128 |
10.4% |
Turnout in Sioux County was quite low: the county has 2,637 inhabitants 18 years and over, according to the 2010 census, and only 1,232 of those turned out to vote (47%). But it was higher than four years ago.
The results looked quite different in Corson County. Clinton lost major ground vis-a-vis Obama there too, but Trump actually won the county, 50% to 46%. That may well have been on the back of the white minority there, though, especially if turnout among the county's American Indians was comparatively low. It certainly looks like that when eyeing the extremely polarized precinct-level results. In general, there is some research suggesting that white voters who live in majority-minority areas (or in proximity to them) are particularly susceptible to voting for the "white” party in response — though there is also research which states that, to the contrary, Trump did especially well in racially isolated areas where people have “little exposure to blacks, Asians, and Hispanics”.
Either way, the results in Sioux county made me curious: how did American Indians in general vote? A mixed-population county like Corson would not help answer that question. Instead, I downloaded a bunch of data from the 2010 Census to calculate which counties had the highest share of American Indians among their 18-and-over population.
Ten counties with a large American Indian majority
In ten counties in the Lower 48, over two-thirds of the adult population identifies their race as only American Indian/Alaska Native:
Highest share of American Indians, among population age 18 and over
|
|
|
| OGLALA DAKOTA |
South Dakota |
94.4% |
| todd |
South Dakota |
84.0% |
| MENOMINEE |
Wisconsin |
83.6% |
| BUFFALO |
South Dakota |
81.5% |
| SIOUX |
North Dakota |
81.0% |
| MCKINLEY |
New Mexico |
73.8% |
| ROLETTE |
North Dakota |
72.5% |
| APACHE |
Arizona |
70.4% |
| ZIEBACH |
South Dakota |
69.6% |
| DEWEY |
South Dakota |
69.4% |
So how did these counties vote? Clinton won all but one of them, usually by overwhelming margins. But turnout was generally very low — almost everywhere lower than in Sioux County (see full size):

Trump's share of the vote increases down the list as you get to counties with a larger white minority, as you'd expect. The only county where he topped Clinton was Ziebach County, SD.
While Jill Stein did well in the North Dakotan counties, Gary Johnson did particularly well in McKinley County, in his native New Mexico — a little better still than state-wide.
North Dakota allows for write-in votes, and no fewer than 4.2% of Sioux County voters went that way: another sign of dissatisfaction with the main party candidates. In 2012, just four Sioux County voters (0.6%) availed themselves of this option.
A significant drop in the Democratic vote
As impressive as some (if not all) of Clinton's majorities in this table look, however, they turn out to actually be very weak, almost across the board, when compared with the 2012 elections (see full size):

Clinton lost significant ground compared to Obama — far more than nationally — everywhere except in Apache County, Arizona. She suffered especially in the two North Dakotan counties as well as Buffalo County, South Dakota.
There look to be some major improvements for Trump there, but there is often less to that than meets the eye. In Menominee county, Trump did get one and a half times as many votes as Romney. But in Buffalo county, for example, he got all of 5 votes more. It's just that the Democratic vote collapsed to such a degree that the same amount of GOP votes translated into a significantly higher percent of the total (see full size):
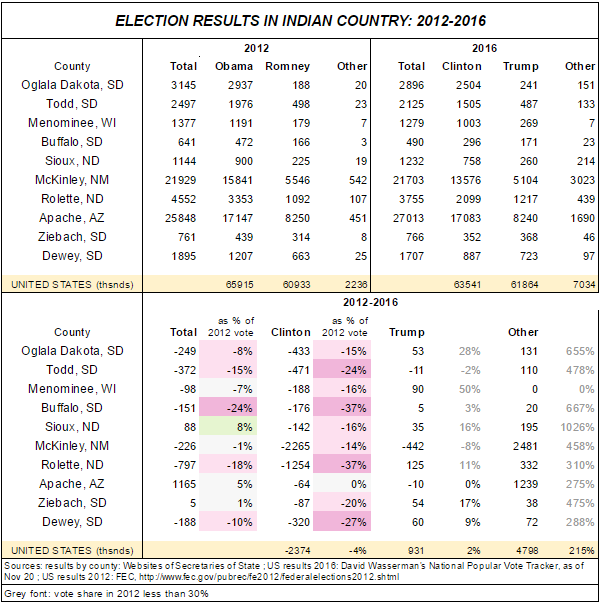
The only two counties where turnout grew were Sioux County and Apache County, AZ. While the new voters seem to have mostly fueled the protest vote in Sioux, they might have made Apache the only county in the list without significant Democratic losses. Ann Kirkpatrick probably had a lot to do with this. Having represented Arizona's 1st Congressional District, which encompasses all of Apache County, for three terms she ran for the US Senate this year. She lost the race but swept Apache County, where she got over a thousand more votes than Hillary Clinton.
In every other county on the list, Clinton lost somewhere between one-in-seven and over one-in-three of the votes Obama had gotten. There seems to have just been a major de-mobilization of the Democratic vote across majority-American Indian country. Lower turnout, a lower Democratic vote, the high Stein and write-in vote in North Dakota, and perhaps some of the expanded Republican vote all seem to indicate dissatisfaction with the Democratic nominee — at least when compared to Obama four years ago.
No early voting for you? The role of voter suppression
Nevertheless, it's important to be on the lookout for additional explanations. The largest drop-offs in both turnout and Clinton vote took place in Buffalo County, SD, and Rolette County, ND. In the former, at least, part of the story might be voter suppression, if this story is anything to go by.
To summarize: the county seat of Buffalo County is a place called Gann Valley. Population? Eleven. The majority of the population lives on the Crow Creek Reservation reservation, in and around Fort Thompson. In 2012, an early voting site was opened there, and Native American voter turnout rose from 55% in 2008 to nearly 75% in 2012, “the largest increase among the state’s 66 counties”.
In 2014, the locals had no such luck: the county's auditor, a white Gann Valley resident, “refused to set aside federal funds to open a satellite office for early voting on the reservation this year.” The only place where the Crow Creek Sioux Tribe could take advantage of the state's 46 days of early absentee voting was in her tiny village — “a 50 mile roundtrip away”. The money was there, activists argued; the authorities just didn't want to spend it on helping Native Americans vote.
Maybe the same happened this year? The drop-off in the Democratic vote was a broader trend, but this story still reminds us that individual anomalies can well be the result of targeted voter suppression efforts as well.
Not just the states they’re in: disproportional losses
I wanted to verify one last thing. Was Hillary Clinton's relatively poor performance really something specific to these majority-minority counties? Or might the American Indian voters there have simply shifted their vote in the same direction as the surrounding states, by the same extent if obviously from a different starting level? Maybe the Turtle Mountain Band of Chippewa Indians up in Rolette County, ND, just shared some of the same frustrations and sensitivities as their white neighbors, and switched votes at the same rate as the rest of their state?
It's definitely true that North and South Dakota as a whole were particularly rough on Hillary Clinton. Obama had received 39-40% of the vote in those two states. Clinton got just 32% in South Dakota, and 27% in North Dakota. But she still took a disproportionately bigger hit in most of the largely American Indian counties than overall in the states they're in. Even in Apache County, where she received practically the same number of votes as Obama in 2012, this compared unfavorably with the state-wide result of Arizona, one of just seven states where Clinton substantially improved on Obama's margin (see full size):

The bigger picture: does this fit the 2012 narrative?
American Indians and Native Alaskans make up just 0.9% of the US adult population, and 0.8% in the Lower 48. The population of these ten counties, specifically, is much smaller still, and constitutes well less than a tenth of a percent of the US population. Moreover, they are located in states that were safe for one presidential contender or the other anyway. So none of these numbers had a material effect on the presidential election outcome.
Nevertheless, they may fit into a broader pattern. The Democratic candidate banked heavily on maximizing minority voter turnout while appealing to potential swing voters among college-educated Republicans, and neither element of that strategy quite fell into place. A lot can be said about the swing to Clinton among the latter group, which was significant yet less than hoped-for or needed, but that's not even tangentially related to this diary. Overall minority turnout perhaps is, as the exit polls saw the balance shift in Trump's favor among all non-white demographics. While Latino Decisions took serious issue with the exit poll data about Hispanics, Harry Enten's review of results from heavily-Hispanic counties and precincts found that Clinton either “didn’t win as large a share of [Latinos] as Obama, or she didn’t convince as many of them to turn out to vote". The same appears to be true for American Indians.
A final point: I know preciously little about American Indians. I read the occasional news report, sometimes something longer too, but I am not what I'd call well-informed. I just collected some election data. If you are among the extremely few who will have read all this and you have explanations, observations, or you can identify anything I've misinterpreted, please let me know.


